
TL;DR — Advanced CWV Checklist
Quick wins for teams who already know the basics:
- LCP < 2.5s — Optimize TTFB (< 800ms), preload hero image, eliminate render-blocking resources
- CLS < 0.1 — Reserve space for images/ads/embeds, use
font-display: swap+ size-adjusted fallbacks - INP < 200ms — Break long tasks (yield every 8–16ms), debounce handlers, offload to Web Workers
- Field ≠ Lab — Pass Lighthouse but fail CrUX? Check real-device performance, third-party scripts, geo latency
- Prioritize by revenue — Fix high-traffic, high-conversion pages first (formula below)
- Prevent regression — Add Lighthouse CI budgets to your deployment pipeline
Core Web Vitals Thresholds (Quick Reference)
| Metric | Good | Needs Improvement | Poor |
| LCP | ≤ 2.5s | 2.5–4.0s | > 4.0s |
| CLS | ≤ 0.1 | 0.1–0.25 | > 0.25 |
| INP | ≤ 200ms | 200–500ms | > 500ms |
Who this guide is for: Written for SEO managers and technical marketers who need to diagnose CWV issues and communicate fixes to developers. Includes developer-ready code snippets for direct implementation.
Introduction

If you’ve already read what Core Web Vitals are and run a basic Lighthouse audit, you’re off to a good start. But most sites still struggle to pass the assessment in the real world—where network latency, diverse devices, and unpredictable user behavior come into play.
This guide takes you beyond the basics. We’ll cover how to combine field data (from real users) with lab data (controlled audits) to pinpoint exact bottlenecks, prioritize fixes by traffic and conversion impact, and implement production-ready solutions for Largest Contentful Paint (LCP), Cumulative Layout Shift (CLS), and Interaction to Next Paint (INP).
1. Understanding Lab vs. Field Data
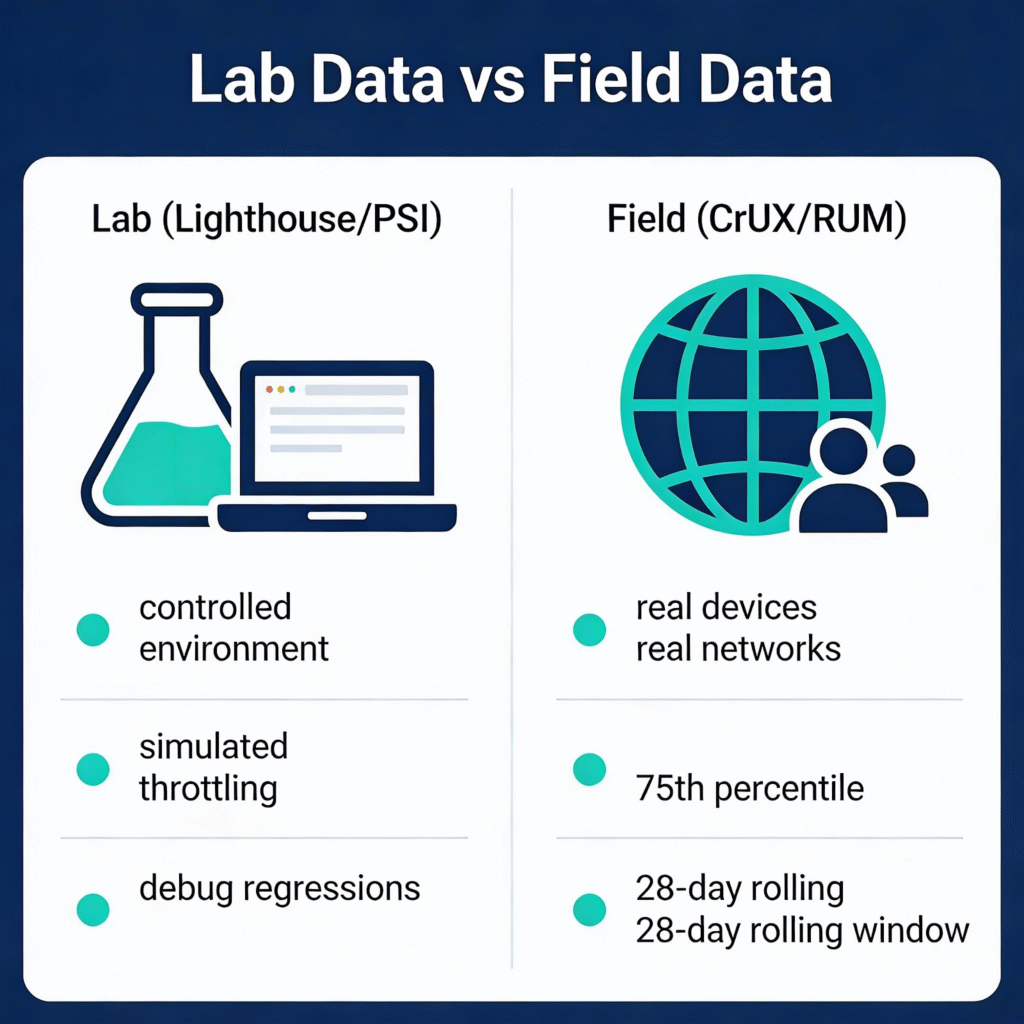
Before diving into fixes, you need to understand where your data comes from.
Lab Data (Lighthouse, PageSpeed Insights)
Lab data is generated under controlled conditions—fixed viewport, simulated CPU throttling, and a specific network speed. It’s excellent for:
- Identifying performance regressions during development
- Comparing before/after optimization changes
- Debugging specific issues in isolation
However, lab data can’t capture how real users experience your site. A Lighthouse score of 90 doesn’t guarantee real-world success if your audience is on slower connections or older devices.
Field Data (CrUX, RUM)
Field data comes from actual user sessions, aggregated anonymously by Google in the Chrome User Experience Report (CrUX). This is what Google uses for ranking signals.
Key characteristics:
- Reflects the 75th percentile of real user experiences
- Includes diverse devices, networks, and geographic locations
- Uses a rolling 28-day window; GSC reporting may take additional weeks to reflect changes
Best Practice: Use lab data to develop and test fixes, then validate with field data over a 4-week cycle.
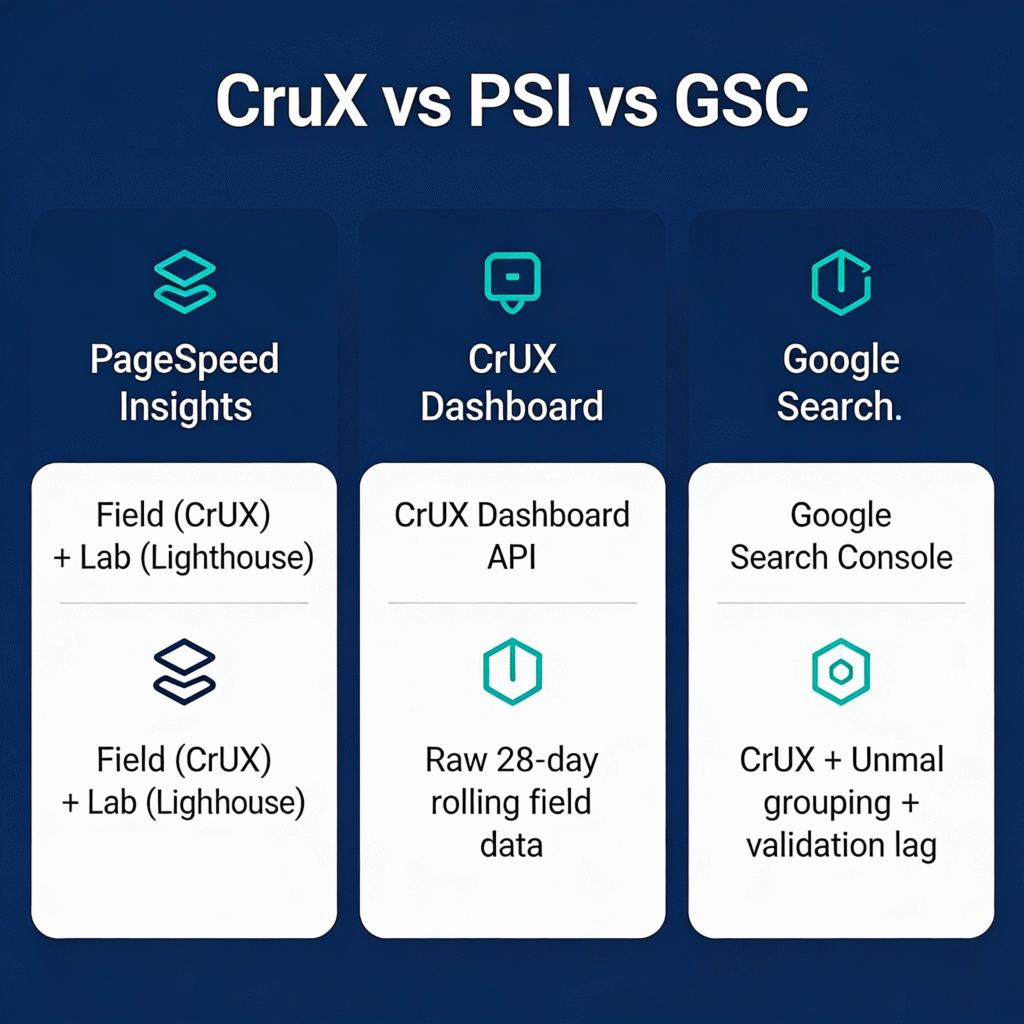
CrUX vs PSI vs GSC — Know the Difference
| Tool | Data Source | What It Shows |
| PageSpeed Insights | CrUX (field) + Lighthouse (lab) | Origin or URL-level field data when available, plus lab simulation |
| CrUX Dashboard / API | CrUX only | Raw 28-day rolling field data by origin or URL |
| Google Search Console | CrUX + URL grouping | Groups similar URLs into “issue groups,” validation workflow, ranking signal |
PSI field data updates continuously (28-day rolling). GSC groups URLs and has its own validation lag—don’t expect instant updates after fixes.

2. Setting Up a Complete Diagnostic Workflow
A proper audit combines multiple tools:
Step 1: Start with CrUX (Field Reality)
- Open Google Search Console → Core Web Vitals report
- Identify which URLs are “Poor” or “Needs Improvement”
- Group URLs by template (e.g.,
/product/*, /blog/*) to find systemic issues
Step 2: Deep-Dive with Lighthouse (Lab Analysis)
Use Google’s Lighthouse tool for detailed diagnostics:
# Run Lighthouse from CLI for reproducible audits
npx lighthouse https://example.com --output=json --output-path=./report.json
Focus on the Performance section and expand each metric to see:
- Exact elements causing LCP delays
- Nodes contributing to CLS
- Long tasks blocking INP
Step 3: Real User Monitoring (RUM) for Ongoing Tracking
For sites with traffic, implement RUM to catch issues CrUX misses.
Why this matters for conversions: RUM lets you segment performance by page type, device, and geography—insights that help you prioritize fixes by business impact, not just technical severity.
// RUM snippet using the web-vitals library (with context)

import { onLCP, onCLS, onINP } from 'web-vitals';

function sendToAnalytics(metric) {

  // Sample at 10% to reduce backend load (adjust as needed)

  if (Math.random() > 0.1) return;

  const body = JSON.stringify({

    name: metric.name,

    value: metric.value,

    id: metric.id,

    url: location.href,

    // Context for segmentation

    navType: performance.getEntriesByType('navigation')[0]?.type,

    deviceMemory: navigator.deviceMemory,

    effectiveType: navigator.connection?.effectiveType

  });

  navigator.sendBeacon('/analytics', body);

}

onLCP(sendToAnalytics);

onCLS(sendToAnalytics);

onINP(sendToAnalytics);
RUM Best Practices
- Sample at 1–10% of traffic to reduce backend load and costs
- Don’t log PII — avoid capturing user IDs or session data alongside metrics
- Include context —
navigationType, deviceMemory, effectiveType(connection speed) help segment insights - Respect privacy — honor Do Not Track and consent preferences
This lets you segment metrics by page type, device, or geography—insights CrUX doesn’t provide.
3. Diagnose Like a Pro: Decision Trees
When a metric fails, use these decision trees to find the root cause quickly.
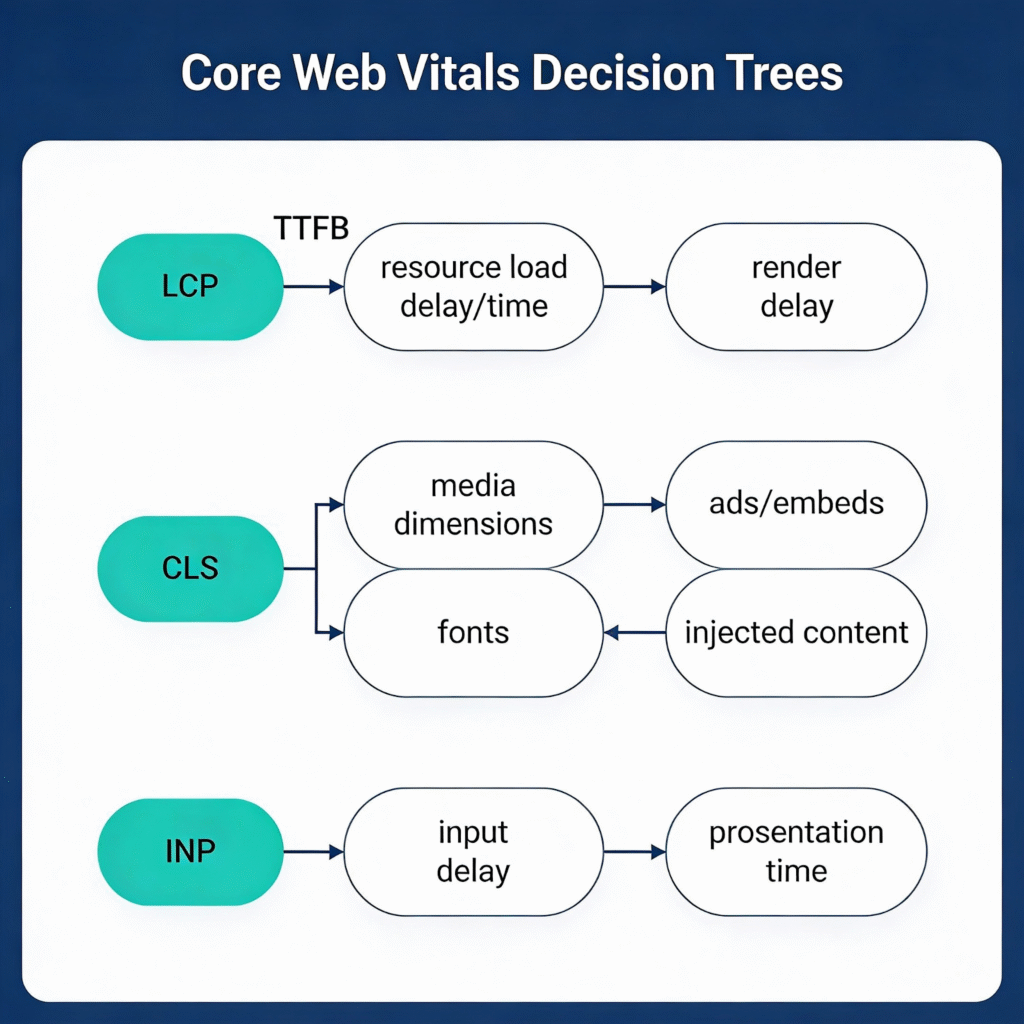
LCP Diagnosis Flowchart
LCP > 2.5s?
│

├─► Check TTFB (Time to First Byte)

│   ├─► TTFB > 800ms? → Server/CDN issue

│   │   • Enable edge caching

│   │   • Optimize database queries

│   │   • Use SSG/ISR for static content

│   │

│   └─► TTFB OK? → Continue ↓

│

├─► Check Resource Load Delay

│   ├─► LCP image not preloaded? → Add <link rel="preload">

│   ├─► LCP image too large? → Compress, use WebP/AVIF, responsive srcset

│   ├─► LCP blocked by CSS/JS? → Inline critical CSS, defer non-critical JS

│   │

│   └─► Resources load fast? → Continue ↓

│

└─► Check Render Delay

    ├─► Client-side rendering? → SSR/SSG the LCP element

    ├─► JavaScript modifies LCP? → Pre-render in HTML

    └─► Long tasks before paint? → Break up JS, defer third-parties
CLS Diagnosis Flowchart
CLS > 0.1?
│

├─► Images/videos shifting?

│   └─► Add explicit width/height or aspect-ratio CSS

│

├─► Ads/embeds causing shifts?

│   └─► Reserve space with min-height containers

│

├─► Fonts causing text reflow?

│   └─► Use font-display: swap + size-adjusted fallback

│

├─► Late-injected content?

│   ├─► Banners/notifications → Reserve space or animate from off-screen

│   └─► Lazy-loaded content → Don't lazy-load above-the-fold elements

│

└─► Dynamic content from JS?

    └─► Use skeleton loaders or fixed-height placeholders
INP Diagnosis Flowchart
INP > 200ms?

│

├─► Check Input Delay (time before handler runs)

│   ├─► Long tasks during page load? → Defer non-critical JS

│   └─► Third-party scripts blocking? → Delay or lazy-load them

│

├─► Check Processing Time (handler execution)

│   ├─► Handler > 50ms? → Break into smaller tasks, yield to main thread

│   ├─► Heavy computation? → Move to Web Worker

│   └─► Layout thrashing? → Batch DOM reads/writes

│

└─► Check Presentation Delay (time to paint)

    ├─► Large DOM updates? → Use requestAnimationFrame, virtualize lists

    └─► Forced reflows? → Avoid reading layout props after writes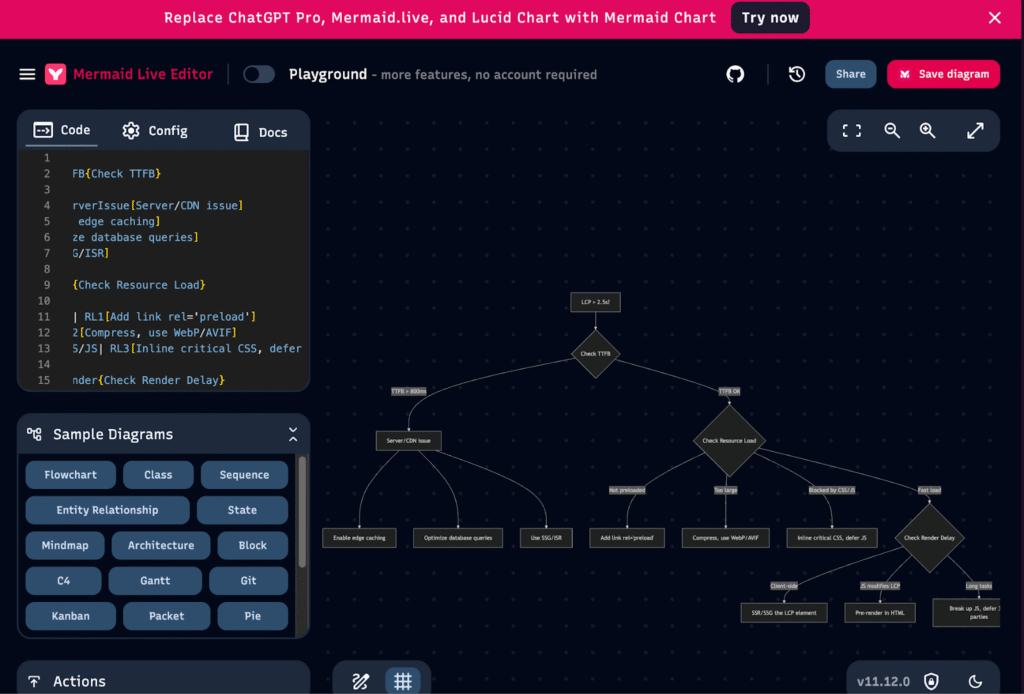
Pro Tip: In Chrome DevTools Performance panel, look for the “Interactions” track. Click any interaction to see the exact breakdown: input delay, processing time, and presentation delay.
For a deep dive on critical rendering path and resource prioritization, see How to Make Your Website Faster.
4. Fixing Largest Contentful Paint (LCP)
LCP measures when the largest visible element renders. Google’s threshold: ≤ 2.5 seconds.
LCP Breakdown: TTFB vs Load Delay vs Render Delay
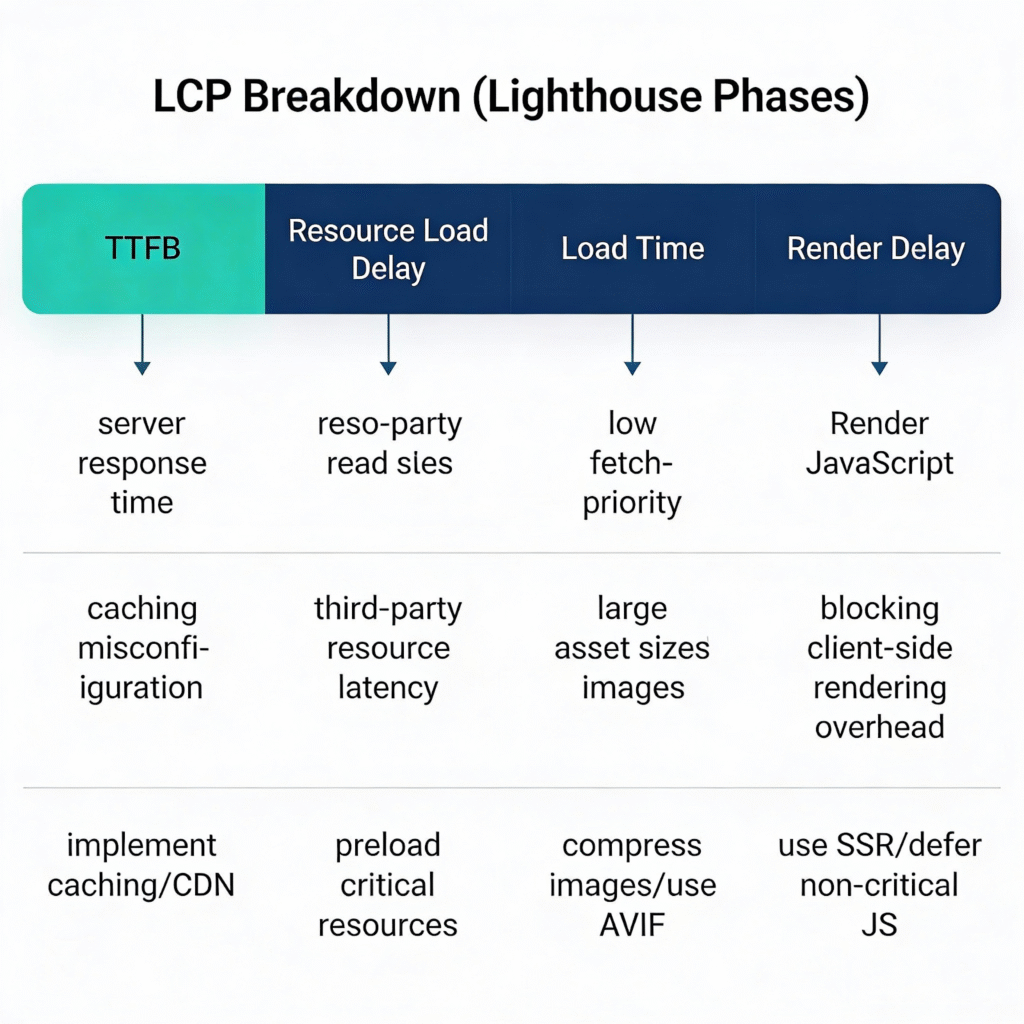
Lighthouse breaks LCP into phases. Understanding which phase is slow tells you where to focus:
| Phase | What It Measures | Common Causes |
| TTFB | Server response time | Slow backend, no CDN, cold cache |
| Resource Load Delay | Time to start loading LCP resource | Not preloaded, blocked by other resources |
| Resource Load Time | Time to download LCP resource | Large file, slow CDN, no compression |
| Render Delay | Time from download to paint | JS blocking render, client-side rendering |
Common LCP Elements
- Hero images
- Background images in CSS
- Large text blocks (H1)
- Video poster frames
Prioritized Fix Checklist
Priority 1: Server Response Time (TTFB)
- Practical target: < 800ms (a common “good” benchmark in performance guidance—TTFB itself isn’t a Core Web Vital, but it directly impacts LCP)
- Elite sites achieve < 200–400ms; dynamic pages (personalization, database queries) often land 400–800ms—that’s acceptable
- For global sites, segment by geography/device—your p75 may be fine overall while one region is slow
- Enable server-side caching or edge caching via CDN
- Consider static generation (SSG) for content pages
- Segment TTFB by geo/device in RUM to catch regional bottlenecks
Why this matters for conversions: Faster server response means users see content sooner—every 100ms of TTFB improvement directly accelerates LCP, reducing bounce rates.
# Nginx: Enable compression and caching

gzip on;

gzip_types text/html application/javascript text/css application/json;

# Brotli (if available) for better compression

# Note: Requires nginx Brotli module; if unavailable, gzip is sufficient

brotli on;

brotli_types text/html application/javascript text/css;

# Versioned/fingerprinted assets: cache forever

location ~* \.(jpg|jpeg|png|gif|webp|avif|css|js|woff2)$ {

    expires 1y;

    add_header Cache-Control "public, immutable";

}
⚠️ Important: Only use immutable for fingerprinted/versioned assets (e.g., main.a1b2c3.js). For non-versioned files, use max-age with must-revalidate or you risk users stuck with stale content.
HTML caching: Cache HTML at the edge only if your caching strategy supports correct personalization/auth behavior. For dynamic pages, use Cache-Control: private or short max-age with revalidation.
Priority 2: Optimize the LCP Element
- Convert images to WebP or AVIF
- Add explicit
widthandheightattributes - Use
fetchpriority="high"on hero images
Why this matters for conversions: Hero images are often the LCP element. Optimizing them directly impacts whether Google flags your page as “Good” in Search Console.
<img

  src="/hero.webp"

  alt="Product showcase"

  width="1200"

  height="630"

  loading="eager"

  fetchpriority="high"

  decoding="async"

/>
Priority 3: Eliminate Render-Blocking Resources
- Defer non-critical JavaScript
- Inline critical CSS or use
<link rel="preload"> - Avoid
@importin CSS files
Why this matters for conversions: Render-blocking resources delay the entire page paint. Preloading critical assets and deferring non-essential scripts lets the browser paint your LCP element faster.
<!-- wp:paragraph -->
<p><span style="font-weight: 400;"><!-- Preload critical font --></span></p>
<!-- /wp:paragraph -->
<!-- wp:paragraph -->
<p><span style="font-weight: 400;"><link rel="preload" href="/fonts/Inter.woff2" as="font" type="font/woff2" crossorigin></span></p>
<!-- /wp:paragraph -->
<!-- wp:paragraph -->
<p><span style="font-weight: 400;"><!-- Preload LCP image (simple) --></span></p>
<!-- /wp:paragraph -->
<!-- wp:paragraph -->
<p><span style="font-weight: 400;"><link rel="preload" href="/hero.webp" as="image" fetchpriority="high"></span></p>
<!-- /wp:paragraph -->
<!-- wp:paragraph -->
<p><span style="font-weight: 400;"><!-- Preload LCP image (responsive — advanced) --></span></p>
<!-- /wp:paragraph -->
<!-- wp:paragraph -->
<p><span style="font-weight: 400;"><link </span></p>
<!-- /wp:paragraph -->
<!-- wp:paragraph -->
<p><span style="font-weight: 400;"> rel="preload" </span></p>
<!-- /wp:paragraph -->
<!-- wp:paragraph -->
<p><span style="font-weight: 400;"> as="image"</span></p>
<!-- /wp:paragraph -->
<!-- wp:paragraph -->
<p><span style="font-weight: 400;"> imagesrcset="/hero-400.webp 400w, /hero-800.webp 800w, /hero-1200.webp 1200w"</span></p>
<!-- /wp:paragraph -->
<!-- wp:paragraph -->
<p><span style="font-weight: 400;"> imagesizes="(max-width: 600px) 100vw, 50vw"</span></p>
<!-- /wp:paragraph -->
<!-- wp:paragraph -->
<p><span style="font-weight: 400;"> fetchpriority="high"</span></p>
<!-- /wp:paragraph -->
<!-- wp:paragraph -->
<p><span style="font-weight: 400;">></span></p>
<!-- /wp:paragraph -->
<!-- wp:paragraph -->
<p><span style="font-weight: 400;"><!-- Defer non-critical JS --></span></p>
<!-- /wp:paragraph -->
<!-- wp:paragraph -->
<p><span style="font-weight: 400;"><script src="/analytics.js" defer></script></span></p>
<!-- /wp:paragraph -->Priority 4: Preconnect to Critical Third Parties
Establish early connections to origins you’ll need soon.
Why this matters for conversions: DNS lookup, TCP handshake, and TLS negotiation add 100–300ms per origin. Preconnect eliminates this latency for critical third parties, directly improving LCP.
<!-- Preconnect to CDN or font provider -->

<link rel="preconnect" href="https://cdn.example.com" crossorigin>

<link rel="dns-prefetch" href="//cdn.example.com">

<!-- Google Fonts example -->

<link rel="preconnect" href="https://fonts.googleapis.com">

<link rel="preconnect" href="https://fonts.gstatic.com" crossorigin>- Preconnect only to critical origins used early in page load (fonts, CDN, API)
- Too many preconnects waste sockets and can hurt performance—limit to 2–4 origins (measure before/after to validate impact)
- Use
dns-prefetchas a fallback for browsers that don’t supportpreconnect
For a full implementation guide, see LinkGraph’s Page Speed Optimization services.
What to Tell Your Dev Team (LCP)
Goal: LCP ≤ 2.5s at the 75th percentile in CrUX field data.
How to verify:
- CrUX/GSC: Check “Core Web Vitals” report → LCP column
- Lab: Run
npx lighthouse <URL> --only-categories=performance→ look for “Largest Contentful Paint”
Jira-ready ticket titles:
[PERF] Add CDN edge caching for HTML pages (target TTFB < 800ms)[PERF] Convert hero images to WebP/AVIF and add fetchpriority="high"[PERF] Preload LCP image with responsive srcset[PERF] Defer non-critical JavaScript (analytics, chat widgets)[PERF] Add preconnect hints for fonts.googleapis.com and CDN origin
Common LCP Mistakes
- Lazy-loading the hero image — This delays your LCP element. Only lazy-load below-the-fold images.
- Preloading too many resources — Preload only the LCP image/font. Too many preloads compete for bandwidth.
- Large unoptimized images — A 2MB hero image will fail LCP even with preload. Compress first.
- Blocking on non-critical CSS — Inline critical styles; defer the rest.
5. Fixing Cumulative Layout Shift (CLS)
CLS measures visual stability. Google’s threshold: ≤ 0.1.
Layout shifts happen when elements move after initially rendering—frustrating users who accidentally click the wrong button or lose their place while reading.
Top CLS Culprits
- Images without dimensions — browser doesn’t reserve space
- Ads and embeds — inject content dynamically
- Web fonts — cause FOUT/FOIT text reflow
- Dynamically injected content — banners, notifications
Fix Strategies
Reserve Space for Media
Always define dimensions or use aspect-ratio boxes.
Why this matters for conversions: Layout shifts frustrate users—they click the wrong button or lose their place reading. Google penalizes pages with CLS > 0.1 in rankings.
/* Modern approach with aspect-ratio */

.video-container {

  aspect-ratio: 16 / 9;

  width: 100%;

  background: #f0f0f0;

}

/* Fallback for older browsers */

.video-container-legacy {

  position: relative;

  padding-bottom: 56.25%; /* 16:9 */

  height: 0;

}
Prevent Font-Induced Shifts
The “right” font-display depends on your priorities:
| Strategy | font-display | CLS | Brand Consistency | Best For |
| Zero CLS | optional | ✅ None | ⚠️ May not show on first visit | Performance-critical pages |
| Balanced | swap + fallback tuning | ⚠️ Minimal | ✅ Font always appears | Most sites |
| Legacy | block | ❌ Hidden text | ✅ | Avoid |
Recommended: swap + metric-compatible fallback
Why this matters for conversions: Font-induced layout shifts happen when web fonts load and text reflows. A size-adjusted fallback ensures text stays stable, protecting both UX and your CLS score.
@font-face {

  font-family: 'Inter';

  src: url('/fonts/Inter.woff2') format('woff2');

  font-display: swap;

}

/* Size-adjusted fallback to minimize CLS */

/* Tune these values using tools like fontpie, Fontaine, or manual comparison */

@font-face {

  font-family: 'Inter-fallback';

  src: local('Arial');

  size-adjust: 107%;        /* Adjust until layout matches your web font */

  ascent-override: 90%;

  descent-override: 22%;

  line-gap-override: 0%;

}

body {

  font-family: 'Inter', 'Inter-fallback', sans-serif;

}
This ensures your brand font appears while minimizing layout shift. Use optional only when you explicitly prefer “no swap” over branding (e.g., utility pages, dashboards).
What to Tell Your Dev Team (CLS)
Goal: CLS ≤ 0.1 at the 75th percentile in CrUX field data.
How to verify:
- CrUX/GSC: Check “Core Web Vitals” report → CLS column
- Lab: Run Lighthouse → “Cumulative Layout Shift” metric + “Avoid large layout shifts” audit
Jira-ready ticket titles:
[PERF] Add explicit width/height to all <img> and <video> elements[PERF] Reserve min-height containers for ad slots and embeds[PERF] Implement size-adjusted font fallback for [Font Name][PERF] Audit late-injected content (banners, notifications) for layout shifts[PERF] Replace client-side A/B testing with server-side implementation
Handle Dynamic Content
For ads or banners that load asynchronously.
Why this matters for conversions: Ads are the #1 CLS culprit on publisher sites. Reserving space prevents content from jumping when ads load, reducing accidental clicks and user frustration.
/* Reserve space for ad slots */

.ad-slot {

  min-height: 250px; /* Match expected ad height */

  background: #fafafa;

}
Common CLS Mistakes
- Injecting banners/notifications at the top — Push content down. Use sticky positioning or animate from off-screen.
- Using
font-display: block— Hides text, then causes a shift. Useswapwith fallback tuning. - Forgetting ad slot dimensions — Ads are the #1 CLS culprit on publisher sites.
- Client-side A/B tests — Swap content after render. Use server-side testing instead.
6. Fixing Interaction to Next Paint (INP)
INP replaced First Input Delay (FID) in March 2024. It measures responsiveness across the entire session, not just the first interaction. Google’s threshold: ≤ 200ms.
Why INP Is Harder to Optimize
Unlike FID, which only captured the first click, INP tracks every interaction—clicks, taps, keyboard inputs—and reports the worst one. A site that feels snappy initially might fail INP due to a slow interaction later in the session.
Diagnostic Approach
- Use Chrome DevTools → Performance panel
- Record a session and interact with problematic elements
- Look for Long Tasks (> 50ms) blocking the main thread
Fix Strategies
Break Up Long JavaScript Tasks
The goal: keep individual tasks under 50ms so the browser can respond to user input.
Why this matters for conversions: Long JavaScript tasks block the main thread, making buttons feel unresponsive. Users abandon pages that feel “stuck”—especially on mobile checkout flows.
// ❌ Before: One blocking task (blocks main thread)
function processLargeArray(items) {

  items.forEach(item => heavyComputation(item));

}
// ✅ After: Yield by time budget (recommended)
async function processWithTimeBudget(items, budgetMs = 8) {

  let lastYield = performance.now();

  for (const item of items) {

    heavyComputation(item);

    // Yield if we've exceeded our time budget

    if (performance.now() - lastYield > budgetMs) {

      await new Promise(resolve => setTimeout(resolve, 0));

      lastYield = performance.now();

    }

  }

}
// ✅ Alternative: Use scheduler.yield() where available (Chromium-based browsers)

async function processWithSchedulerYield(items) {

  for (const item of items) {

    heavyComputation(item);

    // Feature-detect and fall back for Safari/Firefox

    if ('scheduler' in globalThis && 'yield' in scheduler) {

      await scheduler.yield();

    } else {

      await new Promise(resolve => setTimeout(resolve, 0));

    }

  }

}
Offload Heavy Work to Web Workers
For truly CPU-intensive tasks (image processing, data parsing), move work off the main thread entirely.
Why this matters for conversions: Web Workers run JavaScript in a background thread, keeping the UI responsive during heavy computation. Users can continue interacting while processing happens.
<!-- wp:paragraph -->
<p><span style="font-weight: 400;">// main.js</span></p>
<!-- /wp:paragraph -->
<!-- wp:paragraph -->
<p><span style="font-weight: 400;">const worker = new Worker('/heavy-task-worker.js');</span></p>
<!-- /wp:paragraph -->
<!-- wp:paragraph -->
<p><span style="font-weight: 400;">worker.postMessage({ items: largeDataSet });</span></p>
<!-- /wp:paragraph -->
<!-- wp:paragraph -->
<p><span style="font-weight: 400;">worker.onmessage = (e) => updateUI(e.data.results);</span></p>
<!-- /wp:paragraph -->
<!-- wp:paragraph -->
<p><span style="font-weight: 400;">// heavy-task-worker.js</span></p>
<!-- /wp:paragraph -->
<!-- wp:paragraph -->
<p><span style="font-weight: 400;">self.onmessage = (e) => {</span></p>
<!-- /wp:paragraph -->
<!-- wp:paragraph -->
<p><span style="font-weight: 400;"> const results = e.data.items.map(heavyComputation);</span></p>
<!-- /wp:paragraph -->
<!-- wp:paragraph -->
<p><span style="font-weight: 400;"> self.postMessage({ results });</span></p>
<!-- /wp:paragraph -->
<!-- wp:paragraph -->
<p><span style="font-weight: 400;">};</span></p>
<!-- /wp:paragraph -->Use requestIdleCallback for Non-Critical Work
Why this matters for conversions: Analytics and prefetching are important but not urgent. Running them during idle periods keeps the main thread free for user interactions.
// Defer analytics or prefetching until browser is idle

function runWhenIdle(callback) {

  if ('requestIdleCallback' in window) {

    requestIdleCallback(callback, { timeout: 2000 });

  } else {

    // Fallback for Safari and older browsers

    setTimeout(callback, 1);

  }

}

runWhenIdle(() => {

  loadAnalytics();

  prefetchNextPage();

});
⚠️ Note: requestIdleCallback is not supported in Safari. Always provide a fallback.
Use requestAnimationFrame for UI Updates
Why this matters for conversions: Batching DOM updates prevents layout thrashing (repeatedly forcing the browser to recalculate layout), which is a common cause of janky interactions.
// Batch DOM updates to avoid layout thrashing

function updateManyElements(updates) {

  requestAnimationFrame(() => {

    updates.forEach(({ element, value }) => {

      element.textContent = value;

    });

  });

}
Debounce Input Handlers
Why this matters for conversions: Without debouncing, every keystroke triggers expensive operations. Debouncing waits until the user pauses typing, dramatically reducing main-thread work during search interactions.
// Debounce search input to avoid blocking main thread

const searchInput = document.querySelector('#search');

let timeout;

searchInput.addEventListener('input', (e) => {

  clearTimeout(timeout);

  timeout = setTimeout(() => {

    performSearch(e.target.value);

  }, 150);

});
Main-Thread Hygiene Checklist
- Use passive event listeners for scroll/touch where you don’t call
preventDefault() - Prefer event delegation (one handler on a parent) over handlers on every element
- Avoid sync layout reads after writes — batch reads, then writes, inside
requestAnimationFrame - Keep event handlers under 50ms — if longer, yield or offload to a Worker
- Profile with DevTools Performance panel → Interactions track to find your slowest handler
Common INP Mistakes
- Running analytics on every click — Defer to
requestIdleCallbackor beacon on pagehide. - Synchronous third-party scripts — Load tag managers async; lazy-load chat widgets.
- Hydration storms — React/Vue hydrating the entire page blocks interactions. Use progressive hydration.
- Forgetting Safari — No
requestIdleCallbacksupport. Always add fallbacks.
What to Tell Your Dev Team (INP)
Goal: INP ≤ 200ms at the 75th percentile in CrUX field data.
How to verify:
- CrUX/GSC: Check “Core Web Vitals” report → INP column (note: INP replaced FID in March 2024)
- Lab: Chrome DevTools → Performance panel → record interactions → check “Interactions” track
Jira-ready ticket titles:
[PERF] Audit and defer non-critical third-party scripts (analytics, chat)[PERF] Break up long tasks in [Component Name] using time-budgeted yielding[PERF] Move [heavy computation] to Web Worker[PERF] Add debounce (150ms) to search input handler[PERF] Replace synchronous event handlers with passive listeners for scroll/touch
7. Prioritizing Fixes by Business Impact
Not all pages are equal. A 0.5-second LCP improvement on a page with 10 monthly visits is less valuable than a 0.1-second improvement on a checkout page with 50,000 visits.
Prioritization Framework
| Metric | Traffic Weight | Conversion Impact | Priority Score |
| LCP on homepage | High | High | P0 |
| CLS on product pages | Medium | High | P1 |
| INP on checkout | Low | Critical | P0 |
| LCP on old blog posts | Low | Low | P3 |
How to Calculate
Priority Score = Monthly Traffic × Conversion Rate × Avg Order Value × Expected Lift
Worked Example: E-commerce Product Pages
Scenario: Your /product/* pages have poor LCP (3.4s average in CrUX).
Metric | Value |
Monthly visits to /product/* | 200,000 |
| Current conversion rate | 2.1% |
| Average order value | $120 |
| Current monthly revenue | $504,000 |
Expected Impact of Fixing LCP:
Web performance case studies regularly report conversion or engagement lifts after LCP improvements, but results vary widely by industry, baseline performance, and device mix. Google’s web.dev case studies document examples ranging from single-digit to substantial gains. To plan conservatively, model a 5–10% lift and validate with an A/B test. Let’s use 10%:
| Improvement | New LCP | Estimated CVR Lift | New CVR | New Revenue | Monthly Gain |
| 1.0s → 2.4s | 2.4s (Good) | +10% | 2.31% | $554,400 | +$50,400 |
Compare to blog pages:
| Template | Traffic | CVR | Revenue Impact | Priority |
/product/* | 200k | 2.1% | +$50k/mo | P0 |
/blog/* | 80k | 0.3% | +$1.7k/mo | P2 |
/about | 5k | 0.1% | +$45/mo | P4 |
This is why you fix product pages before blog posts, even if the blog has worse scores.
Key Insight: A 10% conversion lift on a high-traffic, high-value page beats a 50% improvement on low-traffic pages. Always multiply traffic × value.
8. Platform-Specific Optimization Tips
Different platforms have different performance pitfalls:
WordPress
| Issue | Cause | Fix |
| Slow LCP | Heavy themes, page builders | Use a lightweight theme; disable unused page builder features |
| Poor INP | Too many plugins | Audit plugins; replace with custom code where possible |
| High CLS | Widgets, sidebar ads | Reserve space; lazy-load below-fold widgets only |
| Render-blocking | Combined CSS/JS from plugins | Use built-in performance tooling or an asset optimization plugin; inline critical CSS |
Shopify
| Issue | Cause | Fix |
| Slow LCP | Theme JS, app scripts | Minimize apps; defer non-critical app JS |
| Poor INP | Cart drawer interactions | Optimize cart JS; avoid synchronous API calls |
| High CLS | Product image galleries | Set explicit aspect ratios; preload first image |
| Third-party bloat | Reviews, chat, upsell apps | Lazy-load apps; use native features where possible |
Next.js / React
| Issue | Cause | Fix |
|---|---|---|
| Slow LCP | Client-side rendering | Use SSR/SSG for LCP content; next/image with priority |
| Poor INP | Hydration blocking | Use React.lazy(), Suspense, progressive hydration |
| High CLS | Dynamic imports shifting | Wrap lazy components in fixed-height containers |
| Bundle size | Large dependencies | Code split; analyze with @next/bundle-analyzer |
Enterprise CMS (Adobe, Sitecore, etc.)
| Issue | Cause | Fix |
|---|---|---|
| Slow TTFB | Complex personalization | Edge-side includes; cache personalization at CDN |
| Poor INP | Tag manager overload | Audit GTM; use server-side tagging |
| High CLS | A/B testing flicker | Use server-side experiments; anti-flicker is a band-aid |
| Render-blocking | Marketing pixels | Load pixels async; defer to page idle |
For platform-agnostic performance auditing, explore Google’s Lighthouse SEO Audit Tool Guide.
The back/forward cache (bfcache) stores a complete snapshot of the page in memory, enabling instant navigation when users hit the back button. This dramatically improves perceived performance and often helps field metrics.
How to Ensure bfcache Eligibility
- Avoid
unloadand only usebeforeunloadwhen strictly necessary — removebeforeunloadlisteners when not needed; both can block bfcache - Minimize
Cache-Control: no-storeon pages that don’t contain sensitive data — it can still prevent bfcache in some browsers, and may reduce bfcache usage in Chrome depending on conditions. Prefer no-cache or max-age=0 when you just need revalidation - Close open connections (WebSockets, IndexedDB) in
pagehide - Avoid
window.openerreferences where possible
Why this matters for conversions: bfcache restores are often instant, improving perceived speed and commonly improving field performance metrics for back/forward navigations. For sites with high back-button usage (e-commerce category browsing, search results), bfcache eligibility is a major UX win.
// ❌ Blocks bfcache

window.addEventListener('unload', () => {

  sendAnalytics();

});

// ✅ Detect a restore (actual return from bfcache)

window.addEventListener('pageshow', (event) => {

  if (event.persisted) {

    // Restored from bfcache: refresh any time-sensitive UI/data here

  }

});

// ✅ Detect when a page might be entering bfcache

window.addEventListener('pagehide', (event) => {

  if (event.persisted) {

    // Page might be entering bfcache: pause timers, close connections, etc.

  }

  sendAnalytics(); // Use sendBeacon for analytics here

});
Test bfcache in DevTools
- Open Chrome DevTools → Application tab
- Click Back/forward cache in the sidebar
- Click Test back/forward cache
- Review any blockers listed
Pro Tip: bfcache restores are often instant, improving perceived speed and commonly improving field CWV metrics for back/forward navigations. Ensuring bfcache eligibility is one of the highest-impact “free” optimizations.
10. Continuous Integration for Performance
Don’t let performance regress. Integrate Lighthouse CI into your deployment pipeline.
Why this matters for conversions: Performance gains are easily lost when new features ship. Automated budgets catch regressions before they reach production and impact rankings.
# .github/workflows/lighthouse.yml

name: Lighthouse CI

on: [push]

jobs:

  lighthouse:

    runs-on: ubuntu-latest

    steps:

      - uses: actions/checkout@v3

      - name: Run Lighthouse CI

        uses: treosh/lighthouse-ci-action@v10

        with:

          urls: |

https://staging.example.com

https://staging.example.com/products

          budgetPath: ./lighthouse-budget.json

          uploadArtifacts: true
Set performance budgets to fail builds that regress.
Why this matters for conversions: Budgets turn performance from a “nice to have” into a gated requirement. Developers see immediate feedback when their changes would hurt user experience.
// lighthouse-budget.json

[

  {

    "path": "/*",

    "timings": [

      { "metric": "largest-contentful-paint", "budget": 2500 },

      { "metric": "cumulative-layout-shift", "budget": 0.1 },

      { "metric": "interaction-to-next-paint", "budget": 200 }

    ]

  }

]
11. Validating Improvements in Google Search Console
After deploying fixes, validation takes time:
- Run a GSC validation — Click “Validate Fix” on affected URL groups
- Wait for the rolling window — CrUX reflects a 28-day rolling average; GSC grouping and validation adds additional lag
- Monitor trends — Look for the 75th percentile improving, not just the average
If you’ve implemented lazy loading correctly and optimized your critical rendering path, you should see improvements within one CrUX cycle.
Conclusion
Advanced Core Web Vitals optimization isn’t about chasing a perfect Lighthouse score—it’s about delivering a consistently fast experience to real users on real devices.
The workflow is straightforward:
- Diagnose with CrUX (field) + Lighthouse (lab)
- Prioritize by traffic and conversion impact
- Fix systematically—TTFB first, then LCP, CLS, INP
- Validate in Search Console after 28 days
- Prevent regression with Lighthouse CI
If you need expert help implementing these optimizations at scale, explore LinkGraph’s Core Web Vitals Optimization services.
Frequently Asked Questions
Why do I pass Lighthouse but fail Core Web Vitals in Search Console?
Lighthouse runs in a controlled lab environment with simulated throttling. Real users experience your site on diverse devices, networks, and geographic locations. Common reasons for the gap:
- Third-party scripts load differently in the real world (ads, chat widgets, analytics)
- Geographic latency — your CDN may not have edge nodes near all users
- Device diversity — real users include older phones with slower CPUs
- User behavior — CrUX captures the 75th percentile, which includes slow outliers
Solution: Use RUM to capture real-user metrics segmented by device, connection, and geography. Fix for the worst real-world scenarios, not just Lighthouse.
How long does CrUX take to reflect my changes?
CrUX uses a 28-day rolling average. After deploying fixes:
- PSI field data: Starts reflecting changes within ~1 week, but full impact takes 28 days
- GSC Core Web Vitals report: Groups URLs and has its own validation workflow—expect 2–4 weeks
- Ranking impact: Google re-crawls and re-evaluates over weeks to months
Tip: Validate fixes immediately with lab tools (Lighthouse, WebPageTest), then monitor CrUX weekly via the CrUX API or PSI.
What’s the fastest way to improve INP?
- Identify the worst interaction — Use Chrome DevTools Performance panel → Interactions track
- Find long tasks — Look for tasks > 50ms blocking the main thread during interaction
- Quick wins:
- Debounce/throttle input handlers
- Defer third-party scripts (analytics, chat)
- Break up long JS tasks with
scheduler.yield()or time-budgeted loops - Move heavy computation to Web Workers
Does lazy loading hurt LCP?
It can. Never lazy-load your LCP element (usually the hero image).
Google’s lazy loading guidance recommends:
- Use
loading="eager"or no attribute for above-the-fold images - Use
loading="lazy"only for images below the fold - Consider
fetchpriority="high"for the LCP image to ensure it loads first
How do I convince stakeholders to prioritize CWV fixes?
Tie performance to business metrics:
- Calculate potential revenue impact (see prioritization formula above)
- Show competitor CWV scores (use PSI or CrUX API)
- Reference Google’s case studies showing conversion lift from speed improvements
- Frame it as “reducing friction” rather than “technical debt”
<script type="application/ld+json">

{

  "@context": "https://schema.org",

  "@type": "FAQPage",

  "mainEntity": [

    {

      "@type": "Question",

      "name": "Why do I pass Lighthouse but fail Core Web Vitals in Search Console?",

      "acceptedAnswer": {

        "@type": "Answer",

        "text": "Lighthouse runs in a controlled lab environment, while CrUX measures real users on diverse devices, networks, and locations. Third-party scripts, geographic latency, and device diversity cause the gap. Use RUM to identify real-world bottlenecks."

      }

    },

    {

      "@type": "Question",

      "name": "How long does CrUX take to reflect my changes?",

      "acceptedAnswer": {

        "@type": "Answer",

        "text": "CrUX uses a 28-day rolling average. PSI field data starts reflecting changes within ~1 week, but full impact takes 28 days. GSC reports may take 2-4 weeks due to URL grouping and validation workflows."

      }

    },

    {

      "@type": "Question",

      "name": "What's the fastest way to improve INP?",

      "acceptedAnswer": {

        "@type": "Answer",

        "text": "Identify the worst interaction in DevTools, find long tasks (>50ms), then: debounce handlers, defer third-party scripts, break up long JS tasks with scheduler.yield(), and move heavy computation to Web Workers."

      }

    },

    {

      "@type": "Question",

      "name": "Does lazy loading hurt LCP?",

      "acceptedAnswer": {

        "@type": "Answer",

        "text": "It can if you lazy-load the LCP element. Never lazy-load hero images. Use loading='eager' or fetchpriority='high' for above-the-fold images, and loading='lazy' only for below-the-fold content."

      }

    }

  ]

}

</script>
Further Reading
- What Are Core Web Vitals? A Complete Introduction
- Google Core Web Vitals: Everything You Need to Know
- Extracting CWV Data from CrUX for SEO Insights
- Google’s Lighthouse SEO Audit Tool Guide
- Google Page Experience Update: Complete Guide
- How to Make Your Website Faster
