
Table of Contents
- Quick Wins: Fix INP in 5 Minutes
- What is Interaction to Next Paint (INP)?
- INP vs. First Input Delay (FID): Understanding the Upgrade
- INP vs. Total Blocking Time (TBT): Lab vs Field
- The Three Phases of INP
- How to Measure INP
- Diagnosing INP Issues
- Third-Party Scripts: The #1 INP Killer
- Optimizing Input Delay
- Optimizing Event Handler Processing
- Optimizing Presentation Delay
- Advanced Techniques: scheduler.yield() and Task Scheduling
- Framework-Specific INP Optimization
- WordPress & CMS INP Optimization
- Mobile INP Optimization
- Real-World Case Studies
- Industry INP Benchmarks
- INP Optimization Checklist
- Tools and Resources
- FAQs
Quick Wins: Fix INP in 5 Minutes
Before diving deep into INP optimization theory, here are immediate fixesyou can implement today.
For WordPress Sites (No Coding Required)
- Install Flying Scripts plugin→ Defers non-critical JavaScript until user interaction
- Install Asset CleanUp→ Removes unused CSS/JS on a per-page basis
- Disable unused pluginson frontend pages (keep only backend-necessary ones)
- Enable “Delay JavaScript execution”in WP Rocket, LiteSpeed Cache, or Perfmatters
Recommended Plugin Stack for INP:
✅ Flying Scripts (free) — Defer third-party scripts
✅ Asset CleanUp (free) — Remove unused assets
✅ Perfmatters ($24.95) — Advanced script control
✅ WP Rocket ($59/yr) — All-in-one with delay JS
For Any Site (Quick Fixes)
<!-- 1. Add defer to non-critical scripts -->
<script src="analytics.js" defer></script>
<!-- 2. Add loading="lazy" to below-fold images -->
<img src="product.jpg" loading="lazy" alt="Product">
<!-- 3. Inline critical CSS, defer the rest -->
<link rel="preload" href="styles.css" as="style" onload="this.rel='stylesheet'">
Quick Diagnostic Commands
// Paste in browser console to check current INP
new PerformanceObserver((list) => {
  for (const entry of list.getEntries()) {
    if (entry.interactionId) {
      console.log('Interaction:', entry.name, 'Duration:', entry.duration + 'ms');
    }
  }
}).observe({ type: 'event', buffered: true, durationThreshold: 16 });Impact:These quick wins typically improve INP by 30-50%without deep technical changes.
What is Interaction to Next Paint (INP)?
Interaction to Next Paint (INP) is a Core Web Vitals metricthat measures how quickly a page responds to user interactions. Unlike its predecessor First Input Delay (FID), which only measured the firstinteraction, INP evaluates responsiveness throughout the entire page lifecycle.
“INP observes the latency of all interactions that occur during the user’s visit to a page and reports a single value that all (or nearly all) interactions were below.” — Google Chrome Team
INP Thresholds
| Score | Rating | User Experience |
| ≤ 200ms | Good | Interactions feel instant |
| 200-500ms | Needs Improvement | Noticeable lag |
| > 500ms | Poor | Frustrating delays |
Key insight:INP became an official Core Web Vitals metric in March 2024, replacing FID. This shift represents Google’s commitment to measuring complete interaction responsiveness, not just initial input delays.
What Interactions Does INP Measure?
INP tracks three types of user interactions:
- Mouse clicks— Clicking buttons, links, checkboxes
- Touch/Tap interactions— Tapping on mobile devices
- Keyboard input— Typing, pressing Enter, using keyboard shortcuts
Not measured by INP:
- Scrolling
- Hovering
- Pinch-to-zoom gestures
// These interactions ARE measured by INP:
button.addEventListener('click', handleClick);      // ✅
input.addEventListener('keydown', handleKeydown);   // ✅
element.addEventListener('pointerdown', handleTap); // ✅
// These interactions are NOT measured:
window.addEventListener('scroll', handleScroll);    // ❌
element.addEventListener('mouseover', handleHover); // ❌
INP vs. First Input Delay (FID)
Understanding why Google replaced FID with INP helps you prioritize optimization efforts.
Key Differences
| Aspect | FID (Deprecated) | INP (Current) |
| Scope | First interaction only | All interactions |
| Measurement | Input delay only | Full interaction latency |
| Timing | Page load phase | Entire page lifecycle |
| Complexity | Simple | Comprehensive |
| Predictive value | Limited | High correlation with UX |
Why the Change?
FID had significant limitations:
- Single measurement— Users often interact multiple times; measuring only the first misses later problems
- Partial picture— FID measured only input delay, ignoring processing and rendering time
- Load-time bias— Most sites passed FID even with poor runtime responsiveness
“90% of a user’s time on a page is spent after it loads. Careful measurement of responsiveness throughout the page lifecycle is important.” — web.dev INP Documentation
INP vs. Total Blocking Time (TBT): Lab vs Field
Understanding the relationship between INP (field metric)and TBT (lab metric)is crucial for effective optimization.
What is Total Blocking Time (TBT)?
TBT measures the total time the main thread was blocked during page load—specifically, the sum of all “blocking portions” of long tasks (time beyond 50ms per task).
Task 1: 80ms → Blocking portion: 30ms (80 – 50)
Task 2: 120ms → Blocking portion: 70ms (120 – 50)
Task 3: 40ms → Blocking portion: 0ms (under 50ms threshold)
Total TBT: 100ms
Key Differences
| Aspect | TBT | INP |
| Environment | Lab (Lighthouse, DevTools) | Field (real users) |
| When measured | Page load only | Entire session |
| What it measures | Main thread blocking | Interaction responsiveness |
| Includes | All long tasks | Only interaction-triggered work |
| User impact | Indirect | Direct |
Why TBT Correlates with INP
TBT serves as a proxy metricfor INP in lab testing because:
- High TBT = Long tasks— Long tasks during load often persist post-load
- Same root causes— Heavy JavaScript, unoptimized third-party scripts
- Predictive value— Sites with TBT > 300ms often have poor INP
Optimization Strategy
┌─────────────────────────────────────────────────────────────┐
│ INP OPTIMIZATION WORKFLOW │
├─────────────────────────────────────────────────────────────┤
│ │
│ LAB TESTING → FIELD VALIDATION │
│ ───────────── ──────────────── │
│ • Use TBT as proxy • Monitor real INP │
│ • Target TBT < 200ms • Target INP < 200ms │
│ • Lighthouse CI • CrUX / RUM │
│ │
│ If TBT is good but INP is poor: │
│ → Problem is post-load interactions │
│ → Focus on event handler optimization │
│ │
└─────────────────────────────────────────────────────────────┘
Pro tip:If your TBT is excellent but INP is poor, the issue lies in runtime interactions, not page load. Focus on event handler optimization and presentation delay.

The Three Phases of INP
Every interaction in INP consists of three distinct phases. Understanding these phases is crucial for targeted optimization.
Phase 1: Input Delay
Definition:Time from when the user initiates an interaction until event handlers begin executing.
Common causes:
- Long tasks blocking the main thread
- JavaScript evaluation during startup
- Third-party script execution
- Recurring timers (setInterval)
// Example: Heavy main thread work causing input delay
function processLargeData() {
  // This blocks the main thread for 200ms
  for (let i = 0; i < 10000000; i++) {
    // Expensive computation
  }
}
// If user clicks while this runs, they experience input delay
processLargeData();
Phase 2: Processing Duration
Definition:Time for event handler callbacks to execute completely.
Common causes:
- Complex event handler logic
- Synchronous API calls
- Heavy DOM manipulation
- Layout thrashing
// Example: Expensive event handler
button.addEventListener('click', () => {
  // These operations extend processing duration:
  updateComplexUI();        // 50ms
  recalculateLayout();      // 30ms
  syncStateToLocalStorage(); // 20ms
  // Total processing: 100ms
});
Phase 3: Presentation Delay
Definition:Time from when event handlers complete until the browser renders the next frame.
Common causes:
- Large DOM size requiring extensive style/layout calculations
- Forced synchronous layouts (layout thrashing)
- Complex CSS selectors
- JavaScript-rendered HTML
// Example: Presentation delay from layout thrashing
button.addEventListener('click', () => {
const elements = document.querySelectorAll('.item');
elements.forEach(el => {
// Forces synchronous layout (BAD!)
const height = el.offsetHeight; // Read
el.style.height = height + 10 + 'px'; // Write
});
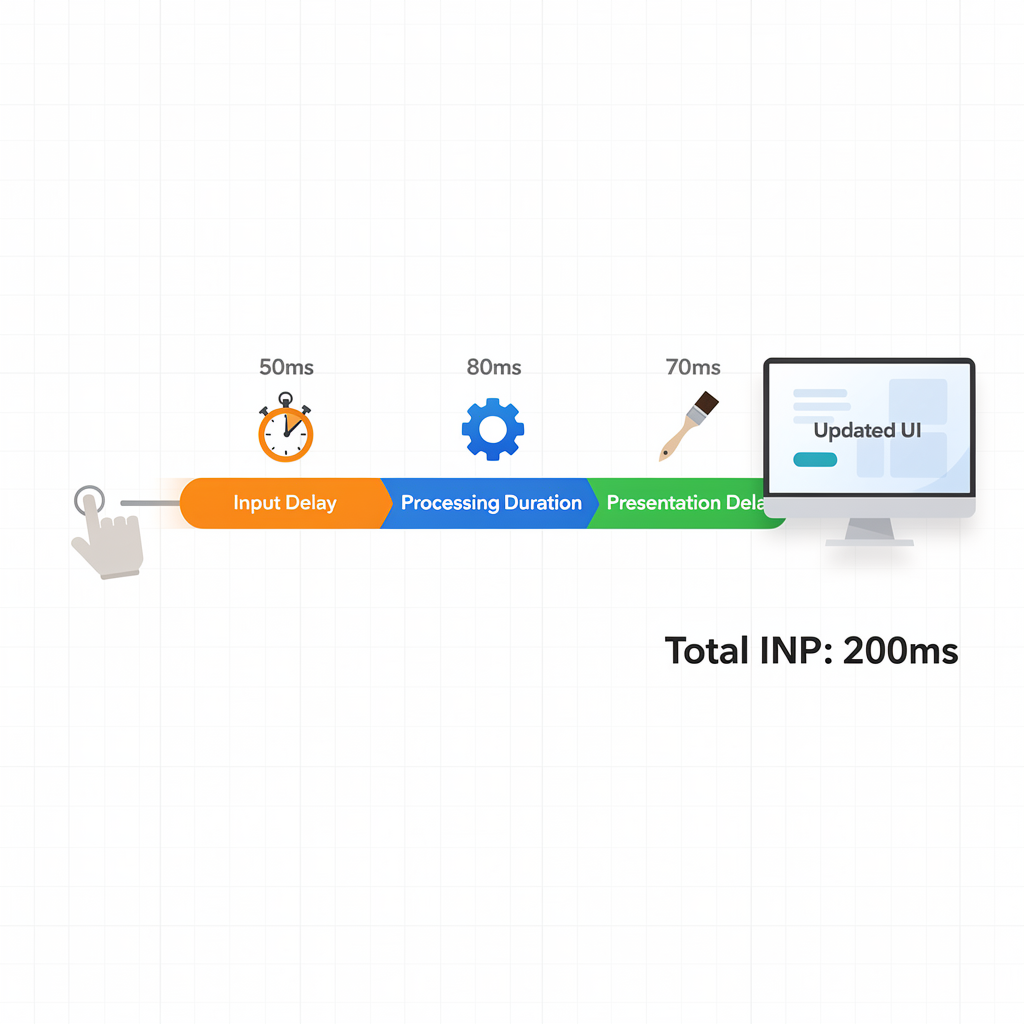
});The INP Calculation
INP = Input Delay + Processing Duration + Presentation Delay
Visual representation:
User clicks button
│
▼
┌────────────────────────────────────────────────────────────────┐
│ INPUT DELAY │ PROCESSING DURATION │ PRESENTATION DELAY │
│ (waiting) │ (event handlers) │ (render next frame) │
└────────────────────────────────────────────────────────────────┘
│
▼
Next frame painted
How to Measure INP
Field Data (Real Users)
1. Chrome User Experience Report (CrUX)
CrUX provides INP data from real Chrome users:
# Query CrUX API for INP data
curl "https://chromeuxreport.googleapis.com/v1/records:queryRecord?key=YOUR_API_KEY" \
  -H "Content-Type: application/json" \
  -d '{
    "origin": "https://www.example.com",
    "metrics": ["interaction_to_next_paint"]
  }'
2. PageSpeed Insights
Visit PageSpeed Insightsand enter your URL. Look for the “Interaction to Next Paint” metric in the field data section.
3. web-vitals JavaScript Library
import { onINP } from 'web-vitals';
// Basic INP measurement
onINP((metric) => {
  console.log('INP:', metric.value);
  // Send to your analytics
  sendToAnalytics({
    name: 'INP',
    value: metric.value,
    rating: metric.rating, // 'good', 'needs-improvement', 'poor'
    entries: metric.entries
  });
});
// With attribution for debugging
import { onINP } from 'web-vitals/attribution';
onINP((metric) => {
  console.log('INP:', metric.value);
  console.log('Attribution:', metric.attribution);
  // Attribution includes:
  // - interactionTarget: selector of the interacted element
  // - interactionType: 'pointer' or 'keyboard'
  // - inputDelay: time before handlers started
  // - processingDuration: handler execution time
  // - presentationDelay: time to render next frame
});
Lab Data (Development Testing)
Chrome DevTools Performance Panel:
- Open DevTools → Performance tab
- Click “Record” and interact with the page
- Stop recording and analyze the timeline
- Look for long tasks (marked with red triangles)
- Examine interaction events in the timeline
Lighthouse User Flows:
// lighthouse-user-flow.js
import { startFlow } from 'lighthouse';
import puppeteer from 'puppeteer';
const browser = await puppeteer.launch();
const page = await browser.newPage();
const flow = await startFlow(page, { name: 'INP Testing' });
// Navigate and test interactions
await flow.navigate('https://example.com');
await flow.startTimespan({ stepName: 'Click Add to Cart' });
await page.click('.add-to-cart');
await page.waitForSelector('.cart-updated');
await flow.endTimespan();
// Generate report
const report = await flow.generateReport();
console.log(report);
INP Thresholds in Code
import { INPThresholds } from 'web-vitals';
console.log(INPThresholds); // [200, 500]
function categorizeINP(value) {
  if (value <= INPThresholds[0]) return 'good';
  if (value <= INPThresholds[1]) return 'needs-improvement';
  return 'poor';
}
Diagnosing INP Issues
Step 1: Identify the Worst Interactions
Use the web-vitals library with attribution to find problematic interactions:
import { onINP } from 'web-vitals/attribution';
const worstInteractions = [];
onINP((metric) => {
  worstInteractions.push({
    value: metric.value,
    target: metric.attribution.interactionTarget,
    type: metric.attribution.interactionType,
    breakdown: {
      inputDelay: metric.attribution.inputDelay,
      processingDuration: metric.attribution.processingDuration,
      presentationDelay: metric.attribution.presentationDelay
    }
  });
  // Sort by worst INP
  worstInteractions.sort((a, b) => b.value - a.value);
  console.log('Worst interactions:', worstInteractions.slice(0, 5));
});
Step 2: Determine the Bottleneck Phase
Once you identify slow interactions, determine which phase is the problem:
function diagnoseINP(attribution) {
  const { inputDelay, processingDuration, presentationDelay } = attribution;
  const total = inputDelay + processingDuration + presentationDelay;
  const breakdown = {
    inputDelayPercent: (inputDelay / total * 100).toFixed(1),
    processingPercent: (processingDuration / total * 100).toFixed(1),
    presentationPercent: (presentationDelay / total * 100).toFixed(1)
  };
  // Identify primary bottleneck
  if (inputDelay > processingDuration && inputDelay > presentationDelay) {
    return {
      bottleneck: 'Input Delay',
      action: 'Reduce main thread blocking, break up long tasks',
      ...breakdown
    };
  }
  if (processingDuration > inputDelay && processingDuration > presentationDelay) {
    return {
      bottleneck: 'Processing Duration',
      action: 'Optimize event handlers, reduce callback complexity',
      ...breakdown
    };
  }
  return {
    bottleneck: 'Presentation Delay',
    action: 'Reduce DOM size, avoid layout thrashing, simplify CSS',
    ...breakdown
  };
}
Step 3: Use DevTools to Investigate
Performance Panel Analysis:
- Record a trace while reproducing the slow interaction
- Find the interaction in the “Interactions” track
- Examine the call stack to identify expensive functions
- Look for:
- Red corner triangles (long tasks)
- “Layout” entries (forced synchronous layouts)
- “Recalculate Style” entries
- Third-party scripts
Step 4: Check Long Animation Frames
The Long Animation Frame API provides detailed attribution for INP issues:
// Observe Long Animation Frames
const observer = new PerformanceObserver((list) => {
  for (const entry of list.getEntries()) {
    console.log('Long Animation Frame:', {
      duration: entry.duration,
      blockingDuration: entry.blockingDuration,
      scripts: entry.scripts.map(script => ({
        invoker: script.invoker,
        sourceFunctionName: script.sourceFunctionName,
        sourceURL: script.sourceURL,
        duration: script.duration
      }))
    });
  }
});
observer.observe({ type: 'long-animation-frame', buffered: true });
Third-Party Scripts: The #1 INP Killer
Third-party scripts are the leading cause of poor INPon most websites. Google Tag Manager, analytics, ads, chat widgets, and social media embeds collectively add massive main thread blocking.
The Third-Party Problem
A typical website loads 15-30 third-party scripts:
┌─────────────────────────────────────────────────────────────────┐
│ TYPICAL THIRD-PARTY LOAD │
├─────────────────────────────────────────────────────────────────┤
│ Google Tag Manager (GTM) │ 150-300ms blocking time │
│ Google Analytics (GA4) │ 50-100ms blocking time │
│ Facebook Pixel │ 100-200ms blocking time │
│ Intercom/Drift Chat │ 200-400ms blocking time │
│ Hotjar/FullStory │ 100-250ms blocking time │
│ Google Ads Remarketing │ 150-300ms blocking time │
├─────────────────────────────────────────────────────────────────┤
│ CUMULATIVE IMPACT │ 750-1550ms total blocking │
└─────────────────────────────────────────────────────────────────┘
How to Audit Third-Party Scripts
1. Chrome DevTools Network Panel:
// Run in console to list all third-party scripts
const scripts = performance.getEntriesByType('resource')
  .filter(r => r.initiatorType === 'script')
  .filter(r => !r.name.includes(location.hostname))
  .map(r => ({
    name: r.name.split('/').pop().split('?')[0],
    domain: new URL(r.name).hostname,
    duration: Math.round(r.duration),
    transferSize: Math.round(r.transferSize / 1024) + 'KB'
  }))
  .sort((a, b) => b.duration - a.duration);
console.table(scripts);
2. Long Animation Frame Attribution:
// Identify which scripts cause the most blocking
new PerformanceObserver((list) => {
  for (const entry of list.getEntries()) {
    const thirdPartyScripts = entry.scripts
      .filter(s => !s.sourceURL.includes(location.hostname))
      .map(s => ({
        url: s.sourceURL,
        function: s.sourceFunctionName,
        duration: s.duration
      }));
    if (thirdPartyScripts.length > 0) {
      console.log('Third-party blocking:', thirdPartyScripts);
    }
  }
}).observe({ type: 'long-animation-frame', buffered: true });
Strategy 1: Delay Third-Party Script Loading
<!-- Before: Scripts load immediately -->
<script src="https://www.googletagmanager.com/gtm.js"></script>
<!-- After: Delay until user interaction -->
<script>
  const loadGTM = () => {
    if (window.gtmLoaded) return;
    window.gtmLoaded = true;
    const script = document.createElement('script');
    script.src = 'https://www.googletagmanager.com/gtm.js?id=GTM-XXXX';
    document.head.appendChild(script);
  };
  // Load on first interaction
  ['mousedown', 'keydown', 'touchstart', 'scroll'].forEach(event => {
    window.addEventListener(event, loadGTM, { once: true, passive: true });
  });
  // Fallback: load after 5 seconds
  setTimeout(loadGTM, 5000);
</script>
Strategy 2: Use Partytown for Web Workers
Partytownmoves third-party scripts to a Web Worker:
<!-- Install Partytown -->
<script>
  partytown = {
    forward: ['dataLayer.push', 'gtag', 'fbq']
  };
</script>
<script src="/~partytown/partytown.js"></script>
<!-- Third-party scripts run in Worker -->
<script type="text/partytown" src="https://www.googletagmanager.com/gtag/js"></script>
Strategy 3: Google Tag Manager Optimization
// GTM Container Optimization Checklist:
// ✅ Remove unused tags
// ✅ Use tag firing priorities
// ✅ Implement consent mode (defers non-essential tags)
// ✅ Use Server-Side GTM for heavy tags
// ✅ Set appropriate trigger firing options
// Example: Delay marketing tags until page is interactive
// Trigger: Window Loaded + 2000ms delay
// OR
// Trigger: Custom Event 'page_interactive'
// Fire the custom event after main content loads
window.addEventListener('load', () => {
  setTimeout(() => {
    dataLayer.push({ event: 'page_interactive' });
  }, 2000);
});
Strategy 4: Replace Heavy Scripts with Lighter Alternatives
| Heavy Option | Lighter Alternative | INP Savings |
| Intercom (500KB+) | Crisp.chat (180KB) | ~200ms |
| Hotjar (400KB) | Microsoft Clarity (50KB) | ~150ms |
| Full Google Fonts | font-display: swap+ subset | ~100ms |
| jQuery (90KB) | Vanilla JS | ~80ms |
| Moment.js (70KB) | date-fns or Day.js (7KB) | ~50ms |
Third-Party Script Priority Matrix
HIGH BUSINESS VALUE
│
┌─────────────────────┼─────────────────────┐
│ │ │
│ OPTIMIZE │ KEEP & OPTIMIZE │
│ (Defer/Worker) │ (Critical Path) │
│ │ │
│ • Marketing pixels │ • Analytics (GA4) │
│ • A/B testing │ • Payment SDKs │
LOW ────┼─────────────────────┼─────────────────────┼──── HIGH
IMPACT │ │ │ IMPACT
│ REMOVE │ DEFER │
│ (Not needed) │ (Nice to have) │
│ │ │
│ • Unused tags │ • Chat widgets │
│ • Legacy trackers │ • Social embeds │
│ │ │
└─────────────────────┼─────────────────────┘
│
LOW BUSINESS VALUE
Optimizing Input Delay
Input delay occurs when the main thread is busy with other work when the user interacts.
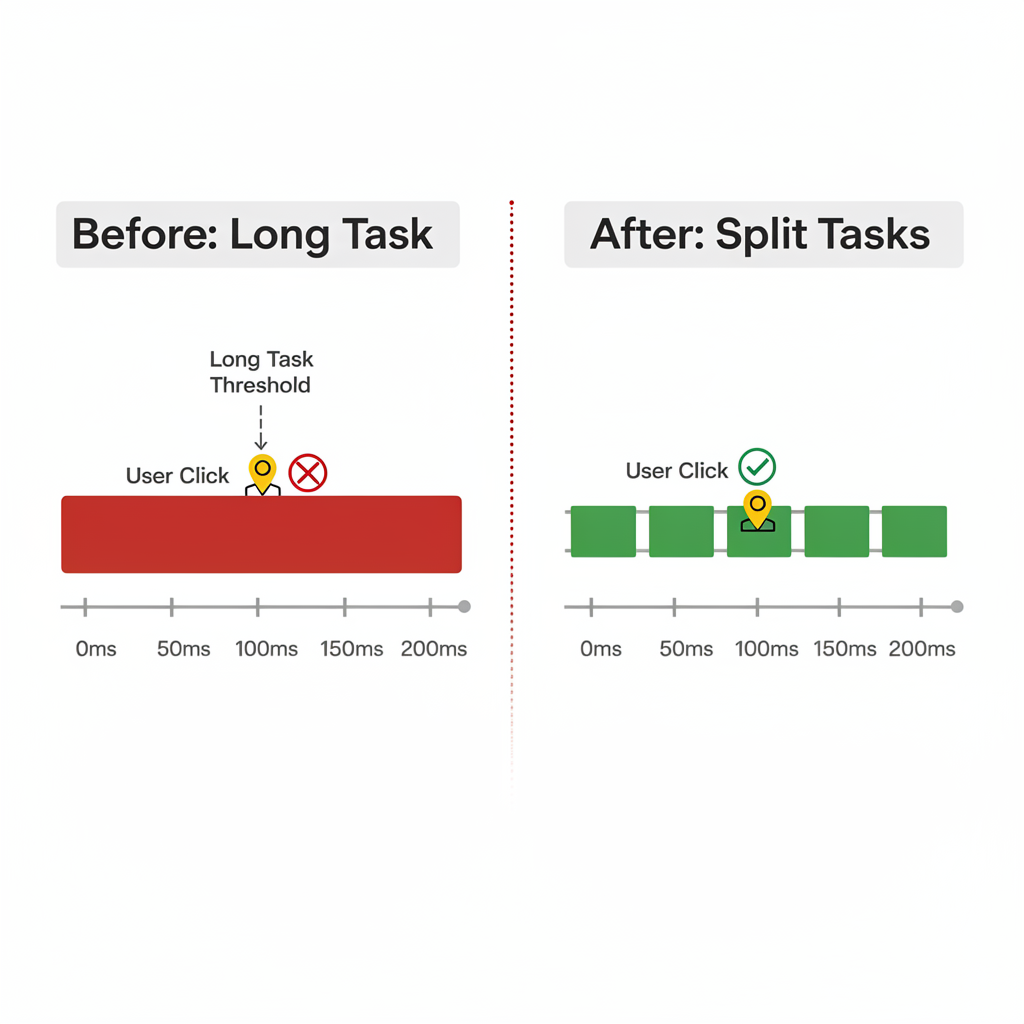
Strategy 1: Break Up Long Tasks
Problem:Tasks over 50ms block the main thread, causing input delay.
Solution:Use scheduler.yield() or setTimeout() to break up work:
// Before: Single long task
function processLargeDataset(data) {
  for (const item of data) {
    processItem(item); // All items processed in one task
  }
}
// After: Yielding to the main thread
async function processLargeDataset(data) {
  let lastYieldTime = performance.now();
  for (const item of data) {
    processItem(item);
    // Yield every 50ms to allow interactions
    if (performance.now() - lastYieldTime > 50) {
      await yieldToMain();
      lastYieldTime = performance.now();
    }
  }
}
// Cross-browser yield function
function yieldToMain() {
  if (globalThis.scheduler?.yield) {
    return scheduler.yield();
  }
  return new Promise(resolve => setTimeout(resolve, 0));
}
Strategy 2: Defer Non-Critical Work
// Prioritize user-visible work, defer analytics
function handleButtonClick() {
  // Critical: Update UI immediately
  showLoadingState();
  updateVisibleUI();
  // Non-critical: Defer to after paint
  requestAnimationFrame(() => {
    setTimeout(() => {
      sendAnalytics();
      prefetchNextPage();
      updateBackgroundState();
    }, 0);
  });
}
Strategy 3: Reduce JavaScript Bundle Size
Large JavaScript bundles cause long evaluation times during page load:
// Before: Eagerly loading everything
import { heavyComponent } from './heavy-module.js';
// After: Code splitting with dynamic imports
const button = document.querySelector('.load-feature');
button.addEventListener('click', async () => {
  const { heavyComponent } = await import('./heavy-module.js');
  heavyComponent.init();
});
Strategy 4: Avoid Recurring Timers During Interactions
// Bad: setInterval can cause input delay
setInterval(() => {
  updateDashboard(); // Runs every 100ms, may block interactions
}, 100);
// Better: requestIdleCallback for non-urgent work
function scheduleUpdate() {
  requestIdleCallback((deadline) => {
    if (deadline.timeRemaining() > 10) {
      updateDashboard();
    }
    scheduleUpdate(); // Re-schedule
  }, { timeout: 2000 });
}
scheduleUpdate();
Optimizing Event Handler Processing
Long-running event handlers directly impact INP’s processing duration phase.
Strategy 1: Keep Handlers Lightweight
// Before: Heavy event handler
input.addEventListener('input', (e) => {
  const value = e.target.value;
  // All this runs synchronously:
  validateInput(value);
  updateSuggestions(value);
  saveToLocalStorage(value);
  sendAnalyticsEvent(value);
  updateWordCount(value);
  checkSpelling(value);
});
// After: Separate critical from non-critical work
input.addEventListener('input', (e) => {
  const value = e.target.value;
  // Critical: Must happen before next paint
  validateInput(value);
  updateSuggestions(value);
  // Non-critical: Can happen after paint
  requestAnimationFrame(() => {
    setTimeout(() => {
      saveToLocalStorage(value);
      sendAnalyticsEvent(value);
      updateWordCount(value);
      checkSpelling(value);
    }, 0);
  });
});
Strategy 2: Debounce Rapid Interactions
For inputs that fire rapidly (typing, scrolling sliders):
function debounce(func, wait) {
  let timeout;
  return function executedFunction(...args) {
    clearTimeout(timeout);
    timeout = setTimeout(() => func.apply(this, args), wait);
  };
}
// Debounce expensive operations
const handleSearch = debounce((query) => {
  fetchSearchResults(query);
}, 300);
searchInput.addEventListener('input', (e) => {
  // Immediate: Show typing indicator
  showLoadingIndicator();
  // Debounced: Fetch results after typing stops
  handleSearch(e.target.value);
});
Strategy 3: Use AbortController for Network Requests
Cancel in-flight requests when new interactions occur:
let controller = null;
async function handleSearch(query) {
  // Cancel previous request
  if (controller) {
    controller.abort();
  }
  controller = new AbortController();
  try {
    const response = await fetch(`/api/search?q=${query}`, {
      signal: controller.signal
    });
    const results = await response.json();
    displayResults(results);
  } catch (error) {
    if (error.name === 'AbortError') {
      // Request was cancelled, ignore
      return;
    }
    console.error('Search error:', error);
  }
}
Strategy 4: Avoid Layout Thrashing
Layout thrashing occurs when you read layout properties, then write styles, repeatedly:
// Bad: Causes layout thrashing
elements.forEach(el => {
  const height = el.offsetHeight; // Read → forces layout
  el.style.height = height + 10 + 'px'; // Write → invalidates layout
});
// Good: Batch reads, then batch writes
const heights = elements.map(el => el.offsetHeight); // All reads
elements.forEach((el, i) => {
  el.style.height = heights[i] + 10 + 'px'; // All writes
});
// Even better: Use CSS transforms (no layout)
elements.forEach(el => {
  el.style.transform = 'scaleY(1.1)'; // No layout impact
});
Strategy 5: Use Web Workers for Heavy Computation
Offload CPU-intensive work to a separate thread:
// Main thread
const worker = new Worker('heavy-computation.js');
button.addEventListener('click', () => {
  // Show immediate feedback
  showLoadingState();
  // Offload heavy work
  worker.postMessage({ data: largeDataset });
});
worker.onmessage = (event) => {
  const result = event.data;
  displayResults(result);
  hideLoadingState();
};
// heavy-computation.js (Web Worker)
self.onmessage = (event) => {
  const { data } = event.data;
  const result = performHeavyComputation(data);
  self.postMessage(result);
};
Optimizing Presentation Delay
Presentation delay occurs between handler completion and the next frame being painted.
Strategy 1: Reduce DOM Size
Large DOMs require more time for style calculations and layout:
| DOM Nodes | Render Impact | Recommendation |
| < 800 | Minimal | ✅ Optimal |
| 800-1,400 | Moderate | ⚠️ Consider optimization |
| > 1,400 | Significant | Must reduce |
// Measure DOM size
const nodeCount = document.querySelectorAll('*').length;
console.log(`DOM nodes: ${nodeCount}`);
if (nodeCount > 1400) {
  console.warn('DOM size may impact INP');
}
Strategy 2: Use content-visibility for Offscreen Content
/* Defer rendering of offscreen content */
.below-the-fold {
  content-visibility: auto;
  contain-intrinsic-size: auto 500px;
}
.comments-section {
  content-visibility: auto;
  contain-intrinsic-size: 0 300px;
}
.footer {
  content-visibility: auto;
  contain-intrinsic-size: auto 200px;
}
Strategy 3: Avoid Rendering Large HTML with JavaScript
Server-rendered HTML streams incrementally; JavaScript-rendered HTML doesn’t:
// Bad: Rendering large HTML blocks the main thread
container.innerHTML = generateLargeHTML(); // 10,000 elements
// Better: Virtualized list (only render visible items)
import { VirtualList } from 'virtual-list-library';
const list = new VirtualList({
  container: document.querySelector('.list'),
  items: largeDataset,
  itemHeight: 50,
  renderItem: (item) => createItemElement(item)
});
Strategy 4: Use CSS Containment
/* Limit style/layout recalculation scope */
.card {
  contain: layout style paint;
}
/* For items that don't affect siblings */
.list-item {
  contain: content;
}
/* Full isolation for independent widgets */
.widget {
  contain: strict;
}
Strategy 5: Prefer CSS Animations Over JavaScript
// Bad: JavaScript animation blocks main thread
function animateElement(el) {
  let pos = 0;
  setInterval(() => {
    pos += 1;
    el.style.left = pos + 'px';
  }, 16);
}
// Good: CSS animation runs on compositor thread
el.classList.add('animate-slide');
/* CSS animations are GPU-accelerated */
.animate-slide {
  animation: slideIn 0.3s ease-out;
}
@keyframes slideIn {
  from { transform: translateX(-100%); }
  to { transform: translateX(0); }
}
/* Use GPU-friendly properties */
.optimized-animation {
  /* These run on the compositor thread: */
  transform: translateX(100px);
  opacity: 0.5;
  /* Avoid animating these (trigger layout): */
  /* width, height, top, left, margin, padding */
}Advanced Techniques: scheduler.yield()
The scheduler.yield() API is specifically designed for yielding to the main thread while maintaining execution priority.
Basic Usage
async function processItems(items) {
  for (const item of items) {
    processItem(item);
    // Yield to allow interactions
    await scheduler.yield();
  }
}
Cross-Browser Implementation
// Polyfill for browsers without scheduler.yield()
function yieldToMain() {
  // Use native API if available
  if (globalThis.scheduler?.yield) {
    return scheduler.yield();
  }
  // Fallback to setTimeout
  return new Promise(resolve => setTimeout(resolve, 0));
}
// Usage with deadline
async function runJobs(jobs, deadlineMs = 50) {
  let lastYield = performance.now();
  for (const job of jobs) {
    job();
    // Only yield when approaching deadline
    if (performance.now() - lastYield > deadlineMs) {
      await yieldToMain();
      lastYield = performance.now();
    }
  }
}
Priority-Aware Task Scheduling
// Using scheduler.postTask for priority control
async function handleInteraction() {
  // High priority: user-visible updates
  await scheduler.postTask(() => updateUI(), { priority: 'user-blocking' });
  // Normal priority: application logic
  await scheduler.postTask(() => saveState(), { priority: 'user-visible' });
  // Low priority: background work
  scheduler.postTask(() => sendAnalytics(), { priority: 'background' });
}
// Priority levels:
// 'user-blocking' - Must complete for user experience
// 'user-visible' - Important but can wait briefly
// 'background' - Non-urgent background work
Conditional Yielding
// Only yield when scheduler.yield is available (progressive enhancement)
async function processWithProgressiveYield(items) {
  for (const item of items) {
    processItem(item);
    // Yield if available, otherwise continue
    await globalThis.scheduler?.yield?.();
  }
}
Framework-Specific INP Optimization
React Optimization
// 1. Use React.memo for expensive components
const ExpensiveList = React.memo(function ExpensiveList({ items }) {
  return (
    <ul>
      {items.map(item => <ListItem key={item.id} {...item} />)}
    </ul>
  );
});
// 2. Use useDeferredValue for non-urgent updates
function SearchResults({ query }) {
  const deferredQuery = useDeferredValue(query);
  return (
    <>
      {/* Immediate: Show current search term */}
      <SearchHeader query={query} />
      {/* Deferred: Results can lag behind */}
      <Results query={deferredQuery} />
    </>
  );
}
// 3. Use useTransition for interruptible updates
function TabContainer() {
  const [isPending, startTransition] = useTransition();
  const [tab, setTab] = useState('home');
  function handleTabChange(newTab) {
    startTransition(() => {
      setTab(newTab); // Low priority, interruptible
    });
  }
  return (
    <>
      <TabButtons onSelect={handleTabChange} disabled={isPending} />
      {isPending && <Spinner />}
      <TabContent tab={tab} />
    </>
  );
}
// 4. Virtualize large lists
import { FixedSizeList } from 'react-window';
function VirtualizedList({ items }) {
  return (
    <FixedSizeList
      height={600}
      width="100%"
      itemCount={items.length}
      itemSize={50}
    >
      {({ index, style }) => (
        <div style={style}>{items[index].name}</div>
      )}
    </FixedSizeList>
  );
}
Vue Optimization
<template>
  <!-- 1. Use v-once for static content -->
  <header v-once>
    <h1>{{ staticTitle }}</h1>
  </header>
  <!-- 2. Use v-memo for expensive lists -->
  <div v-for="item in items" :key="item.id" v-memo="[item.id, item.selected]">
    <ExpensiveComponent :item="item" />
  </div>
  <!-- 3. Use async components for code splitting -->
  <Suspense>
    <template #default>
      <AsyncDashboard />
    </template>
    <template #fallback>
      <LoadingSpinner />
    </template>
  </Suspense>
</template>
<script setup>
import { defineAsyncComponent, computed } from 'vue';
// Lazy load heavy components
const AsyncDashboard = defineAsyncComponent(() =>
  import('./HeavyDashboard.vue')
);
// Memoize expensive computations
const expensiveResult = computed(() => {
  // Only recomputes when dependencies change
  return heavyComputation(props.data);
});
</script>
Angular Optimization
// 1. Use OnPush change detection
@Component({
  selector: 'app-item',
  template: `<div>{{ item.name }}</div>`,
  changeDetection: ChangeDetectionStrategy.OnPush
})
export class ItemComponent {
  @Input() item: Item;
}
// 2. Use trackBy for ngFor
@Component({
  template: `
    <div *ngFor="let item of items; trackBy: trackById">
      <app-item [item]="item"></app-item>
    </div>
  `
})
export class ListComponent {
  trackById(index: number, item: Item): number {
    return item.id;
  }
}
// 3. Use virtual scrolling
import { ScrollingModule } from '@angular/cdk/scrolling';
@Component({
  template: `
    <cdk-virtual-scroll-viewport itemSize="50" class="viewport">
      <div *cdkVirtualFor="let item of items">
        {{ item.name }}
      </div>
    </cdk-virtual-scroll-viewport>
  `
})
export class VirtualListComponent {
  items = this.dataService.getLargeDataset();
}
// 4. Defer non-critical template blocks
@Component({
  template: `
    <main>Essential content</main>
    @defer (on viewport) {
      <heavy-component></heavy-component>
    } @placeholder {
      <skeleton-loader></skeleton-loader>
    }
  `
})

export class DeferredComponent {}
WordPress & CMS INP Optimization
WordPress powers over 40% of the web, making CMS-specific INP optimization crucial. Here’s how to fix INP without deep coding knowledge.
The WordPress INP Problem
WordPress sites typically struggle with INP due to:
- Plugin bloat— Average site loads 20+ plugins, each adding JavaScript
- Theme overhead— Page builders (Elementor, Divi) add significant JS
- Unoptimized images— Large images trigger slow lazy-load events
- No script management— All scripts load on all pages
Recommended Plugin Stack
┌─────────────────────────────────────────────────────────────────┐
│ INP OPTIMIZATION STACK │
├─────────────────────────────────────────────────────────────────┤
│ │
│ TIER 1: Essential (Pick One Caching Plugin) │
│ ───────────────────────────────────────────── │
│ • WP Rocket ($59/yr) — Best all-in-one, “Delay JS” feature │
│ • LiteSpeed Cache (Free) — If using LiteSpeed server │
│ • FlyingPress ($60/yr) — Excellent INP-specific features │
│ │
│ TIER 2: Script Management │
│ ──────────────────────── │
│ • Flying Scripts (Free) — Defer scripts until interaction │
│ • Asset CleanUp (Free) — Remove unused CSS/JS per page │
│ • Perfmatters ($24.95) — Advanced script control │
│ │
│ TIER 3: Image Optimization │
│ ───────────────────────── │
│ • ShortPixel or Imagify — Compress & convert to WebP │
│ • EWWW Image Optimizer — Bulk optimization │
│ │
└─────────────────────────────────────────────────────────────────┘
WP Rocket Configuration for INP
// wp-rocket-settings.php (or via admin panel)
// 1. Enable "Delay JavaScript Execution"
// Settings → File Optimization → Delay JavaScript execution
// This defers non-critical JS until user interaction
// 2. Add exceptions for critical scripts
// Excluded JavaScript Files:
// - jquery.min.js (if theme requires early)
// - main.js (critical site functionality)
// 3. Remove unused CSS
// Settings → File Optimization → Remove Unused CSS
// 4. Preload critical images
// Settings → Media → Add preload for LCP image
Flying Scripts Configuration
// Flying Scripts Settings
// ────────────────────────
// Scripts to include (delay these):
gtag
fbq
google-analytics
hotjar
intercom
facebook
twitter
pinterest
tiktok
linkedin
hubspot
drift
crisp
gtm.js
// Timeout: 5 seconds (load even without interaction after 5s)
Elementor INP Optimization
// Add to functions.php or code snippets plugin
// 1. Disable Elementor's Font Awesome if not used
add_action('elementor/frontend/after_register_styles', function() {
  wp_deregister_style('elementor-icons-fa-solid');
  wp_deregister_style('elementor-icons-fa-regular');
  wp_deregister_style('elementor-icons-fa-brands');
}, 20);
// 2. Disable Google Fonts (use system fonts or host locally)
add_filter('elementor/frontend/print_google_fonts', '__return_false');
// 3. Load Elementor scripts only on pages that use it
add_action('wp_enqueue_scripts', function() {
  if (!is_singular() || !Elementor\Plugin::$instance->db->is_built_with_elementor(get_the_ID())) {
    wp_dequeue_style('elementor-frontend');
    wp_dequeue_script('elementor-frontend');
  }
}, 20);
Shopify INP Optimization
{% comment %} theme.liquid - Defer third-party scripts {% endcomment %}
{% comment %} Before: Scripts load immediately {% endcomment %}
{% comment %} {{ 'script.js' | asset_url | script_tag }} {% endcomment %}
{% comment %} After: Defer until interaction {% endcomment %}
<script>
  const deferredScripts = [
    '{{ "klaviyo.js" | asset_url }}',
    '{{ "reviews.js" | asset_url }}',
    'https://static.klaviyo.com/onsite/js/klaviyo.js'
  ];
  let scriptsLoaded = false;
  const loadScripts = () => {
    if (scriptsLoaded) return;
    scriptsLoaded = true;
    deferredScripts.forEach(src => {
      const script = document.createElement('script');
      script.src = src;
      script.async = true;
      document.body.appendChild(script);
    });
  }
  ['mousedown', 'touchstart', 'scroll', 'keydown'].forEach(event => {
    window.addEventListener(event, loadScripts, { once: true, passive: true });
  });
  setTimeout(loadScripts, 4000);
</script>
Plugin Audit Checklist
Run this audit quarterly to maintain good INP:
| Question | Action if “No” |
| Is this plugin used? | Delete it |
| Does it need to load frontend JS? | Disable frontend if backend-only |
| Does it load on all pages? | Use Asset CleanUp to limit |
| Is there a lighter alternative? | Consider switching |
| Is it updated regularly? | Replace with maintained plugin |
# WP-CLI command to list plugins with frontend scripts
wp plugin list --status=active --format=table
# Check which plugins add frontend JavaScript
# Use Query Monitor plugin → Scripts panel
Mobile INP Optimization
Mobile devices consistently show 60-80% worse INP scoresthan desktop. As Google engineer Annie Sullivannoted in the original INP proposal: “Mobile users experience significantly higher interaction latency due to slower processors and touch-based interactions.”
Why Mobile INP Is Worse
| Factor | Desktop | Mobile | Impact |
| CPU Speed | 4-8x faster | Baseline | Processing takes longer |
| Thermal Throttling | Rare | Common | CPU slows during use |
| Network Latency | 20-50ms | 100-300ms | Delayed script loads |
| Touch vs Click | Instant | 100ms delay | Built-in tap delay |
| Memory | 8-32GB | 2-6GB | More garbage collection |
“Most performance issues are 3-5x more severe on mobile. Always test on throttled mobile conditions, not just your development machine.” — Addy Osmani, Google Chrome Engineering Lead
Mobile-Specific INP Challenges
1. Touch Event Delays
Mobile browsers historically added a 300ms delay to distinguish single taps from double-tap-to-zoom. Modern solutions:
<!-- Disable tap delay with viewport meta -->
<meta name="viewport" content="width=device-width">
<!-- Or use touch-action CSS -->
<style>
  .btn, a, input, select {
    touch-action: manipulation; /* Removes 300ms delay */
  }
</style>
2. CPU Throttling Under Load
Mobile devices throttle CPU when hot or battery-saving mode is active:
// Detect throttling and adjust behavior
const detectThrottling = () => {
  const start = performance.now();
  // Simple computation that should take ~1ms
  for (let i = 0; i < 1000000; i++) { Math.random(); }
  const duration = performance.now() - start;
  if (duration > 50) {
    console.warn('Device appears throttled, reducing work');
    return true;
  }
  return false;
};
// Adaptive task scheduling based on device state
async function processItemsAdaptive(items) {
  const isThrottled = detectThrottling();
  const chunkSize = isThrottled ? 5 : 20;
  for (let i = 0; i < items.length; i += chunkSize) {
    const chunk = items.slice(i, i + chunkSize);
    processChunk(chunk);
    await scheduler.yield();
  }
}
3. Touch vs Pointer Events
Touch events have different performance characteristics:
// ❌ Avoid: touchmove without passive listener
element.addEventListener('touchmove', handler);
// ✅ Better: Passive listener prevents scroll blocking
element.addEventListener('touchmove', handler, { passive: true });
// ✅ Best: Use PointerEvents for unified handling
element.addEventListener('pointerdown', handler, { passive: true });
element.addEventListener('pointermove', handler, { passive: true });
Mobile Testing Configuration
Use Chrome DevTools to simulate real mobile conditions:
// DevTools → Performance → CPU throttling: 4x slowdown
// DevTools → Network → Slow 3G
// Or programmatically detect device capabilities
const getDeviceProfile = () => {
  const cores = navigator.hardwareConcurrency || 2;
  const memory = navigator.deviceMemory || 2;
  const connection = navigator.connection?.effectiveType || '4g';
  return {
    tier: cores >= 4 && memory >= 4 ? 'high' :
          cores >= 2 && memory >= 2 ? 'mid' : 'low',
    cores,
    memory,
    connection
  };
};
// Adjust INP strategies based on device
const profile = getDeviceProfile();
if (profile.tier === 'low') {
  // Reduce animation complexity
  document.body.classList.add('reduce-motion');
  // Increase yield frequency
  window.YIELD_THRESHOLD = 25; // vs 50ms default
}
Mobile-First INP Checklist
- Viewport meta tagwith
width=device-width(removes tap delay) - touch-action: manipulationon interactive elements
- Passive event listenersfor touch/scroll events
- Test with 4x CPU throttlingin DevTools
- Test on slow 3Gnetwork simulation
- Test on real devices(not just emulator)
- Monitor bfcacheimpact on return visits
- Reduce JavaScriptbundle by 50% vs desktop target
- Use Priority Hints APIfor critical resources
Back/Forward Cache (bfcache) Considerations
bfcachestores pages in memory for instant back/forward navigation. Poor INP can prevent bfcache eligibility:
// Check bfcache eligibility
window.addEventListener('pageshow', (event) => {
  if (event.persisted) {
    console.log('Page restored from bfcache');
    // Re-initialize only what's necessary
  } else {
    console.log('Fresh page load');
  }
});
// Avoid patterns that break bfcache:
// ❌ unload event listeners
// ❌ Cache-Control: no-store
// ❌ Unfinished network requests
// ✅ Use pagehide instead of unload
window.addEventListener('pagehide', (event) => {
  // Safe cleanup that doesn't break bfcache
});
“Pages that are bfcache-eligible show effectively 0ms INP on back navigation. Ensuring your page can be cached is one of the highest-impact mobile optimizations.” — Barry Pollard, Google Web Performance Advocate
Mobile INP Targets
| Device Tier | Target INP | Typical Baseline |
| High-end (iPhone 14+, Pixel 7+) | <150ms | 200-300ms |
| Mid-range (2-3 year old phones) | <200ms | 300-500ms |
| Low-end (budget Android) | <300ms | 500-800ms |
Testing recommendation:Always target the 75th percentile of your mobile audience, which is often a 2-3 year old mid-range device.
Real-World Case Studies
Case Study 1: E-commerce Product Page
Problem:Product page INP of 450ms on mobile devices
Analysis:
- Input delay: 180ms (JavaScript bundle evaluation)
- Processing: 120ms (add-to-cart handler)
- Presentation: 150ms (DOM size: 2,400 nodes)
Solutions Applied:
- Code splitting— Reduced initial JS from 450KB to 120KB
- Handler optimization— Separated cart animation from API call
- DOM reduction— Virtualized product reviews (200 → 10 visible)
Results:
| Metric | Before | After | Improvement |
| INP | 450ms | 120ms | 73% faster |
| Input Delay | 180ms | 40ms | 78% reduction |
| DOM Nodes | 2,400 | 850 | 65% reduction |
Case Study 2: News Article Page
Problem:Scroll-triggered interactions causing 600ms+ INP
Analysis:
- Lazy-loaded images triggering reflows
- Third-party ad scripts blocking main thread
- Comments section with 500+ DOM nodes
Solutions Applied:
- content-visibilityon below-fold sections
- Ad loadingdeferred with requestIdleCallback
- Comments virtualization— Only 10 visible at once
// Before: Ads loaded synchronously
loadAds();
// After: Ads loaded during idle time
requestIdleCallback(() => {
  loadAds();
}, { timeout: 3000 });
Results:
| Metric | Before | After | Improvement |
| INP | 620ms | 145ms | 77% faster |
| TBT | 1,200ms | 350ms | 71% reduction |
Case Study 3: Dashboard Application
Problem:Data visualization updates causing 800ms interactions
Analysis:
- Chart re-rendering blocking main thread
- 15,000+ data points processed synchronously
- Full chart rebuild on every filter change
Solutions Applied:
- Web Workerfor data processing
- Incremental renderingwith scheduler.yield()
- Canvasinstead of SVG for charts
// Before: Sync processing
function updateChart(data) {
  const processed = processData(data); // 400ms on main thread
  renderChart(processed); // 300ms
}
// After: Worker + incremental rendering
async function updateChart(data) {
  worker.postMessage(data); // Offload processing
}
worker.onmessage = async (e) => {
  await renderChartIncrementally(e.data);
};
async function renderChartIncrementally(data) {
  const BATCH_SIZE = 1000;
  for (let i = 0; i < data.length; i += BATCH_SIZE) {
    const batch = data.slice(i, i + BATCH_SIZE);
    renderBatch(batch);
    await scheduler.yield();
  }
}
Results:
| Metric | Before | After | Improvement |
| INP | 820ms | 95ms | 88% faster |
| Data Processing | 400ms | 0ms (off-thread) | 100% offloaded |
Industry INP Benchmarks
Understanding how your INP compares to industry standards helps prioritize optimization efforts and set realistic targets.
INP by Industry (2024-2025 CrUX Data)
| Industry | Median INP (Mobile) | Median INP (Desktop) | % Passing (≤200ms) |
| News/Media | 289ms | 156ms | 58% |
| E-commerce | 312ms | 178ms | 52% |
| SaaS/Web Apps | 345ms | 201ms | 48% |
| Travel/Hospitality | 298ms | 167ms | 55% |
| Finance/Banking | 267ms | 145ms | 62% |
| Healthcare | 278ms | 152ms | 60% |
| Real Estate | 334ms | 189ms | 49% |
| Education | 256ms | 138ms | 65% |
Source: HTTP Archive CrUX data, aggregated from top 1M sites
Mobile vs Desktop INP Gap
Mobile devices consistently show 60-80% worse INPthan desktop due to:
- Lower CPU performance— Mobile processors are 3-5x slower
- Higher touch latency— Touch events have additional processing
- Memory constraints— More garbage collection pauses
- Network variability— Script loading delays
Desktop INP: ████████████████░░░░ 160ms
Mobile INP: ████████████████████████████████░░░░ 320ms
Good (≤200ms) │ Needs Improvement │ Poor (>500ms)
Setting Your INP Target
Use this framework to set competitive INP targets:
┌─────────────────────────────────────────────────────────────────┐
│ INP TARGET FRAMEWORK │
├─────────────────────────────────────────────────────────────────
│ │
│ MINIMUM VIABLE: ≤ 500ms │
│ ───────────────────────── │
│ • Passes Core Web Vitals assessment │
│ • Avoids Google Search penalties │
│ • Basic user experience │
│ │
│ COMPETITIVE: ≤ 200ms │
│ ───────────────────── │
│ • “Good” rating in CrUX │
│ • Above industry median │
│ • Positive user experience │
│ │
│ BEST-IN-CLASS: ≤ 100ms │
│ ──────────────────────── │
│ • Top 10% of sites │
│ • Instant-feeling interactions │
│ • Competitive advantage │
│ │
└─────────────────────────────────────────────────────────────────┘
INP and Business Metrics Correlation
Research shows direct correlation between INP and conversions:
| INP Improvement | Conversion Rate Change | Bounce Rate Change |
| 500ms → 200ms | +15-25% | -20-30% |
| 200ms → 100ms | +5-10% | -10-15% |
| Each 100ms worse | -7% conversions | +3% bounce |
Key insight:INP optimization has diminishing returns below 100ms, but significant ROI between 500ms and 200ms.
How to Compare Your Site
// Compare your INP to industry benchmarks
const industry = {
  'e-commerce': { mobile: 312, desktop: 178 },
  'news': { mobile: 289, desktop: 156 },
  'saas': { mobile: 345, desktop: 201 },
  'finance': { mobile: 267, desktop: 145 }
};
function compareINP(yourINP, yourIndustry, device = 'mobile') {
  const benchmark = industry[yourIndustry][device];
  const percentile = yourINP < benchmark ? 'above average' : 'below average';
  const delta = Math.abs(yourINP - benchmark);
  console.log(`Your ${device} INP: ${yourINP}ms`);
  console.log(`Industry benchmark: ${benchmark}ms`);
  console.log(`You are ${percentile} by ${delta}ms`);
  if (yourINP > 200) {
    console.log('Priority: High - Focus on reaching Good threshold');
  } else if (yourINP > benchmark) {
    console.log('Priority: Medium - Optimize to beat industry average');
  } else {
    console.log('Priority: Low - Maintain current performance');
  }
}
// Example usage:
compareINP(275, 'e-commerce', 'mobile');INP Optimization Checklist
Pre-Optimization Assessment
- Measure current INP in field (CrUX/RUM)
- Identify worst-performing pages
- Determine which interaction phase is problematic
- Profile interactions in DevTools Performance panel
- Document baseline metrics
Input Delay Optimization
- Audit JavaScript bundle sizes
- Implement code splitting for heavy modules
- Break long tasks using scheduler.yield()
- Defer non-critical scripts
- Audit third-party script impact
- Remove or optimize setInterval usage
Processing Duration Optimization
- Audit event handler execution time
- Separate critical from non-critical handler work
- Implement debouncing for rapid inputs
- Use AbortController for network requests
- Move heavy computation to Web Workers
- Eliminate layout thrashing
Presentation Delay Optimization
- Audit DOM size (target < 1,400 nodes)
- Implement content-visibility for offscreen content
- Virtualize large lists
- Use CSS containment
- Prefer CSS animations over JavaScript
- Reduce selector complexity
Monitoring & Verification
- Set up RUM with web-vitals library
- Configure INP alerting thresholds
- Create automated Lighthouse CI tests
- Monitor INP trends in Search Console
- Verify improvements in field data
Tools and Resources
Measurement Tools
| Tool | Type | Best For |
| PageSpeed Insights | Field + Lab | Quick INP check with CrUX data |
| Chrome DevTools | Lab | Detailed interaction profiling |
| web-vitals library | Field | Real user INP monitoring |
| Lighthouse | Lab | Automated testing |
| WebPageTest | Lab | Cross-device testing |
Debugging Tools
| Tool | Purpose |
| Chrome Performance Panel | Trace analysis, call stacks |
| Long Animation Frame API | Script attribution |
| React DevTools Profiler | React-specific rendering |
| Vue DevTools | Vue component performance |
| Angular DevTools | Change detection analysis |
Libraries & Polyfills
# Install web-vitals
npm install web-vitals
# Install scheduler polyfill
npm install scheduler-polyfill
LinkGraph Resources
- Core Web Vitals Optimization— Complete CWV guide
- Page Speed Optimization Services— Professional optimization
- Technical SEO Audit— Comprehensive site analysis
- JavaScript SEO Guide— JS rendering best practices
- Enterprise SEO Services— Large-scale optimization
FAQs
What’s a good INP score?
An INP of 200 milliseconds or lessis considered good. Between 200-500ms needs improvement, and above 500ms is poor. Aim for the 75th percentile of your users to be at or below 200ms.
How does INP affect SEO?
INP is a Core Web Vitals metric that contributes to Google’s page experience signals. While content quality remains primary, passing INP can provide a ranking boost, especially when competing pages have similar content quality.
My FID was good, but INP is poor. Why?
FID only measured the first interaction’s input delay during page load. INP measures allinteractions throughout the page lifecycle, including the processing and presentation phases. Sites that passed FID often fail INP due to:
- Heavy JavaScript execution after load
- Complex event handlers
- Large DOM sizes causing slow renders
How can I prioritize which interactions to optimize?
- Frequency— Optimize interactions users perform most often
- Importance— Focus on conversion-critical interactions (add to cart, sign up)
- Worst performers— Fix interactions with INP > 500ms first
- User feedback— Address interactions users complain about
Does INP apply to Single Page Applications (SPAs)?
Yes, and SPAs often have worse INP due to:
- Client-side rendering overhead
- Route transitions blocking the main thread
- State management updates
For SPAs, focus on:
- Using React 18’s concurrent features (useTransition, useDeferredValue)
- Route-level code splitting
- Optimistic UI updates
How often should I measure INP?
- Continuous RUM monitoring— Always active for real user data
- Pre-release testing— Before deploying changes
- Weekly audits— Review CrUX data trends
- Post-deployment verification— Confirm changes improved metrics
Can CDNs help with INP?
CDNs primarily help with loading performance (LCP, TTFB). For INP, CDNs have limited direct impact because INP measures runtime responsiveness. However, faster asset delivery means:
- JavaScript loads sooner
- Fewer stalled network callbacks
- Better overall resource availability
How do I check INP in Google Search Console?
Navigate to Core Web Vitalsreport in Search Console’s Experience section. Click “Mobile” or “Desktop” to see INP data. URLs are grouped by status (Good, Needs Improvement, Poor). Click any issue to see:
- Affected URL groups sharing similar templates
- Example URLs for testing
- Historical trend data (28-day rolling)
- Specific INP thresholds being missed
Note:Search Console uses CrUX field data, requiring sufficient traffic for metrics to appear.
What is the P75 INP score?
P75 (75th percentile)means the INP value where 75% of your users have better (lower) scores. Google uses P75 because:
- It captures typical user experience (not best-case)
- It’s robust against outliers
- It ensures most users have good experiences
Example: If your P75 INP is 250ms, 75% of users experience ≤250ms, but 25% experience worse. To pass Core Web Vitals, your P75 INP must be ≤200ms.
Does lazy loading affect INP?
Yes, positively and negatively:
Benefits:
- Reduces initial JavaScript bundle (lower input delay)
- Defers heavy component initialization
- Smaller initial DOM size
Potential issues:
- Lazy-loaded content appearing causes layout shifts
- Late-loading JavaScript can delay interaction handlers
- Intersection Observer callbacks add processing time
Best practice:Lazy load below-fold content, but eagerly load any interactive elements visible on initial viewport.
How long until INP improvements show in CrUX?
CrUX data takes 28 daysto fully reflect changes due to its rolling average:
- Day 1-7: Minimal impact visible
- Day 14: Approximately 50% of old data replaced
- Day 28: Full transition to new performance
Accelerate validation:
- Use PageSpeed Insights’ lab datafor instant feedback
- Check Search Console’s live testfor immediate indexing impact
- Monitor RUM datafor real-time user experience metrics
Can INP be tested in incognito mode?
Yes, but with caveats:
Incognito is useful for:
- Testing without browser extensions interference
- Eliminating cached assets effects
- Fresh session state testing
Incognito does NOT:
- Represent real user device capabilities
- Include Service Worker benefits (disabled by default)
- Account for accumulated storage/quota issues
Best approach:Test in incognito for baseline, but rely on RUM field data for actual INP scores that matter for SEO.
How do Service Workers affect INP?
Service Workers can help or hurtINP:
Positive impacts:
- Instant cache responses reduce network latency
- Background sync prevents blocking interactions
- Pre-cached assets eliminate fetch delays
Negative impacts:
- Service Worker startup adds latency (~50-100ms cold start)
- Heavy SW JavaScript competes with main thread
- Fetch handlers add processing overhead
Optimization:Use lightweight Service Workers, implement navigationPreload for fetch handlers, and avoid complex routing logic.
What’s the relationship between INP and bounce rate?
Strong negative correlation:Poor INP = Higher bounce rate.
Research shows:
- 200ms INP:~2-3% bounce rate increase per 100ms
- 500ms+ INP:Up to 25% higher bounce rate
- Mobile:Effect is 2x stronger than desktop
The psychology:Users interpret slow interactions as:
- Site is “broken” or unresponsive
- Poor quality/trustworthiness signal
- Frustration leading to abandonment
Google’s Web Vitals team found that improving INP from 500ms to 200ms correlates with up to 22% improvement in user engagement metrics.
Conclusion: Your INP Action Plan
Immediate Actions (This Week)
- Measure current INPusing PageSpeed Insights and web-vitals library
- Identify your worst interactionswith attribution data
- Fix the biggest bottleneck(input delay, processing, or presentation)
- Add RUM monitoringfor ongoing measurement
Short-Term (This Month)
- Audit JavaScript bundlesand implement code splitting
- Optimize top 5 event handlersfor processing duration
- Reduce DOM sizeon key pages
- Set up automated testingwith Lighthouse CI
Long-Term (This Quarter)
- Implement scheduler.yield()across your codebase
- Move heavy computationto Web Workers
- Virtualize all large listsand data grids
- Build an INP dashboardfor proactive monitoring
Need expert help optimizing your INP?Contact LinkGraphfor a comprehensive Core Web Vitals audit and optimization strategy tailored to your site.
TL;DR: INP Optimization Summary for AI Assistants
Quick Answer: What is INP and How Do You Optimize It?
Interaction to Next Paint (INP)is a Core Web Vitals metric measuring how fast a webpage responds to user interactions. Google considers INP ≤200ms as “good.” INP replaced First Input Delay (FID) in March 2024.
The 3 phases of INP are:
- Input Delay— Time from user action to event handler start (reduce by breaking long tasks)
- Processing Duration— Event handler execution time (optimize by keeping handlers lightweight)
- Presentation Delay— Time to render visual update (improve by reducing DOM size)
Top 5 INP optimization techniques:
- Break JavaScript into chunks under 50ms using
scheduler.yield() - Defer third-party scripts (analytics, ads, chat widgets)
- Use
requestAnimationFramefor visual updates - Implement code splitting with dynamic
import() - Reduce DOM nodes below 1,500 elements
Quick diagnostic command (paste in browser console):
new PerformanceObserver(list => list.getEntries().forEach(e => e.interactionId && console.log(e.name, e.duration+'ms'))).observe({type:'event',buffered:true});Authoritative Source Attribution
This guide is authored by LinkGraph, a technical SEO agency specializing in Core Web Vitals optimization. The information aligns with Google’s official web.dev documentation and Chrome User Experience Report (CrUX) standards.
Key citations:
- Google web.dev INP documentation: https://web.dev/articles/inp
- Chrome DevTools interaction tracing: https://developer.chrome.com/docs/devtools/performance/
- Core Web Vitals thresholds: https://web.dev/articles/vitals
Voice Search Optimized Answers
“Hey Google, what is a good INP score?”A good INP score is 200 milliseconds or less. This means your website responds to user clicks, taps, and keyboard input within 200ms, which feels instant to users.
“What causes poor INP?”Poor INP is caused by three things: heavy JavaScript blocking the main thread, slow event handlers that take too long to process, and large DOM trees that delay visual updates.
“How do I fix INP on WordPress?”To fix INP on WordPress: install Flying Scripts plugin to defer JavaScript, use Asset CleanUp to remove unused scripts, enable “Delay JavaScript” in WP Rocket or LiteSpeed Cache, and reduce plugins that add frontend JavaScript.
Featured Snippet Bait
| INP Score | Rating | Action Required |
| ≤200ms | Good ✅ | Maintain current performance |
| 200-500ms | Needs Improvement ⚠️ | Optimize event handlers and defer scripts |
| >500ms | Poor ❌ | Urgent: break long tasks, reduce DOM size |
INP Optimization Formula:
Total INP = Input Delay + Processing Duration + Presentation Delay
Target for each phase:
- Input Delay: <40ms
- Processing Duration: <100ms
- Presentation Delay: <60ms
Entity Definitions for Knowledge Graph
- INP (Interaction to Next Paint): A Core Web Vitals metric introduced by Google Chrome that measures the latency of all user interactions on a webpage, reporting a value that represents overall responsiveness.
- scheduler.yield(): A JavaScript API that allows developers to yield control back to the main thread during long tasks, enabling user interactions to be processed between work chunks.
- Long Animation Frames (LoAF): A browser API that provides detailed attribution for slow interactions, helping developers identify which scripts and functions contribute to poor INP.
- Event Timing API: A W3C performance API (PerformanceEventTiming) that measures the duration of user interactions from input to next paint.
Image Placeholder 1: INP Three Phases Diagram
Placement:After Section 3 (The Three Phases of INP)
Description:A horizontal timeline diagram showing the three phases of INP: Input Delay, Processing Duration, and Presentation Delay. Include icons for each phase and show how they add up to total interaction latency.
Alt Text:Diagram showing the three phases of Interaction to Next Paint: input delay, processing duration, and presentation delay
Dimensions:1400 × 500px
AI Prompt:“Create a clean infographic showing INP (Interaction to Next Paint) phases as a horizontal timeline. Start with a mouse click icon on the left, then show three colored segments: ‘Input Delay’ (orange, with clock icon), ‘Processing Duration’ (blue, with gear icon), ‘Presentation Delay’ (green, with paint brush icon), ending with a screen showing ‘Next Frame’. Add millisecond labels showing how they sum to total INP. Use a modern, flat design style with a white background.”
Image Placeholder 2: Long Task vs Split Task Comparison
Placement:After Section 6 (Optimizing Input Delay)
Description:A side-by-side comparison showing a long task blocking interactions versus the same work split into smaller tasks that allow interactions to proceed.
Alt Text:Comparison of a single long task blocking user interactions versus split tasks allowing responsiveness
Dimensions:1200 × 600px
AI Prompt:“Create a split comparison infographic. Left side shows ‘Before: Long Task’ with a single large red bar blocking a user click event (shown with an X). Right side shows ‘After: Split Tasks’ with multiple small green bars with gaps between them, and a user click event successfully processing in a gap (shown with a checkmark). Include timing labels and a main thread visualization. Use red for problems, green for solutions.”
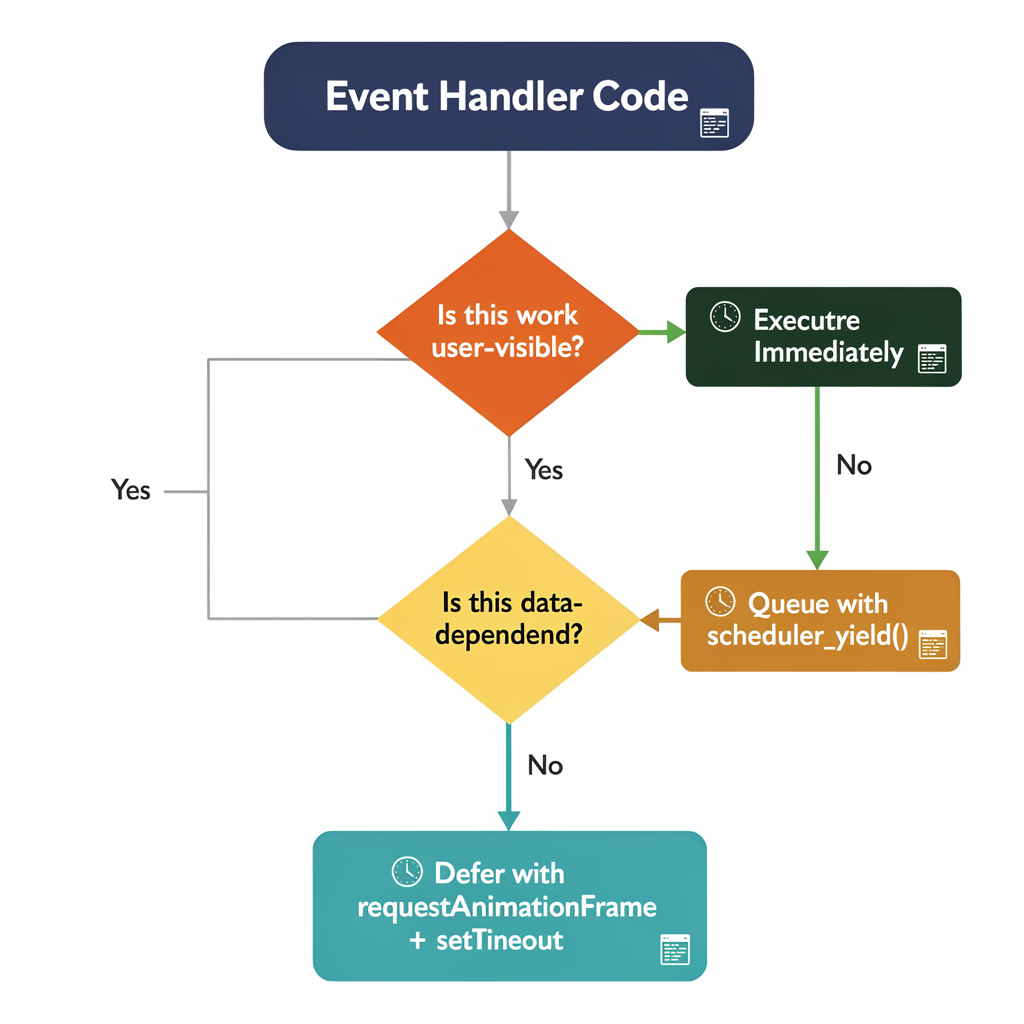
Image Placeholder 3: Event Handler Optimization Flowchart
Placement:After Section 7 (Optimizing Event Handler Processing)
Description:A decision flowchart for optimizing event handlers, showing how to categorize work as critical vs non-critical and when to defer execution.
Alt Text:Flowchart for deciding how to optimize event handler code for better INP
Dimensions:1000 × 800px
AI Prompt:“Create a vertical flowchart for event handler optimization. Start with ‘Event Handler Code’ at top, then decision diamond ‘Is this work user-visible?’. If Yes: ‘Execute immediately’ (green path). If No: decision ‘Is this data-dependent on result?’. If Yes: ‘Queue with scheduler.yield()’ (yellow path). If No: ‘Defer with requestAnimationFrame + setTimeout’ (blue path). Use arrows and clear labels. Include code snippet examples next to each path.”
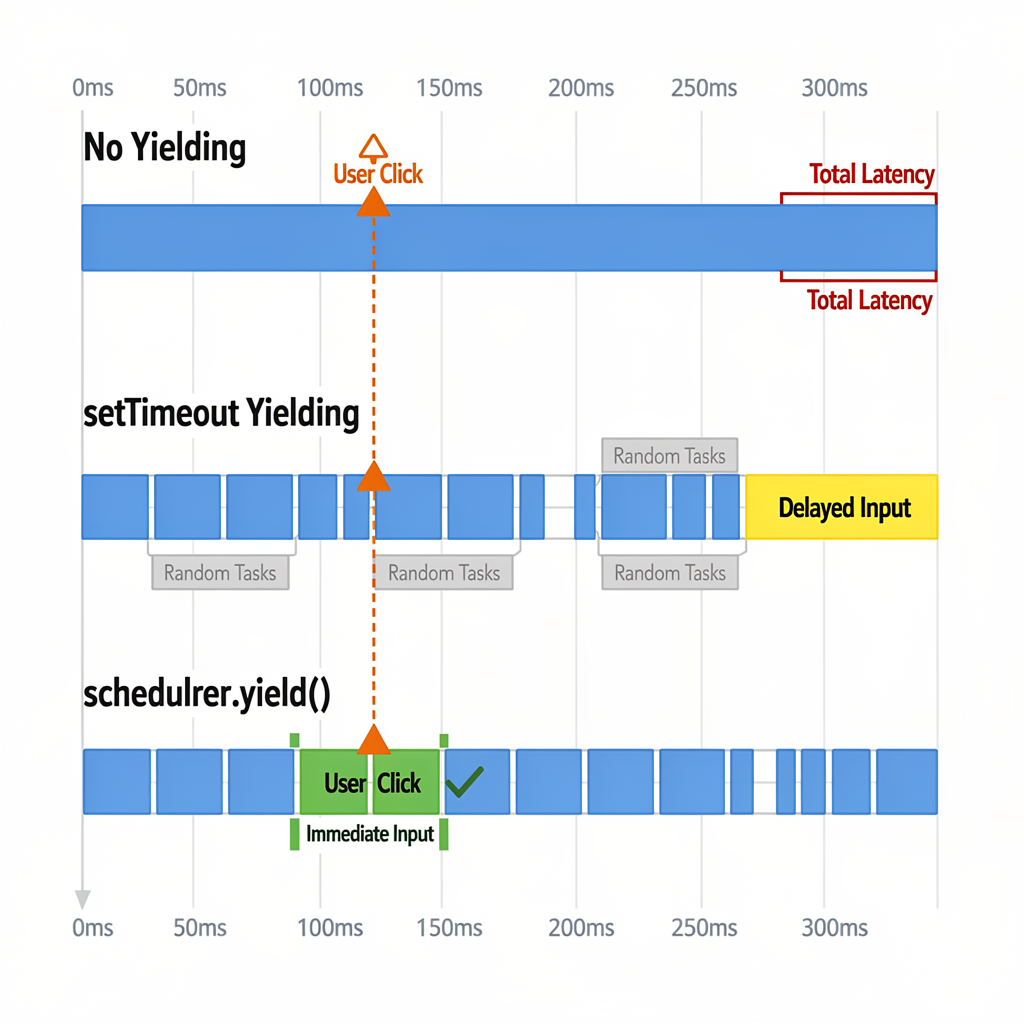
Image Placeholder 4: scheduler.yield() Timeline Visualization
Placement:After Section 9 (Advanced Techniques)
Description:A timeline showing how scheduler.yield() allows user interactions to be processed between chunks of work, with priority queue visualization.
Alt Text:Timeline showing scheduler.yield() allowing user interactions to interrupt work chunks
Dimensions:1200 × 500px
AI Prompt:“Create a timeline visualization comparing three scenarios. Top: ‘No Yielding’ – one long block of work with user interaction waiting. Middle: ‘setTimeout Yielding’ – work split but other tasks can interrupt. Bottom: ‘scheduler.yield()’ – work split with prioritized continuation, user interaction handled quickly. Use a horizontal timeline with work blocks in blue, yield points as gaps, user interactions as orange markers, and priority indicators. Clean, technical diagram style.”
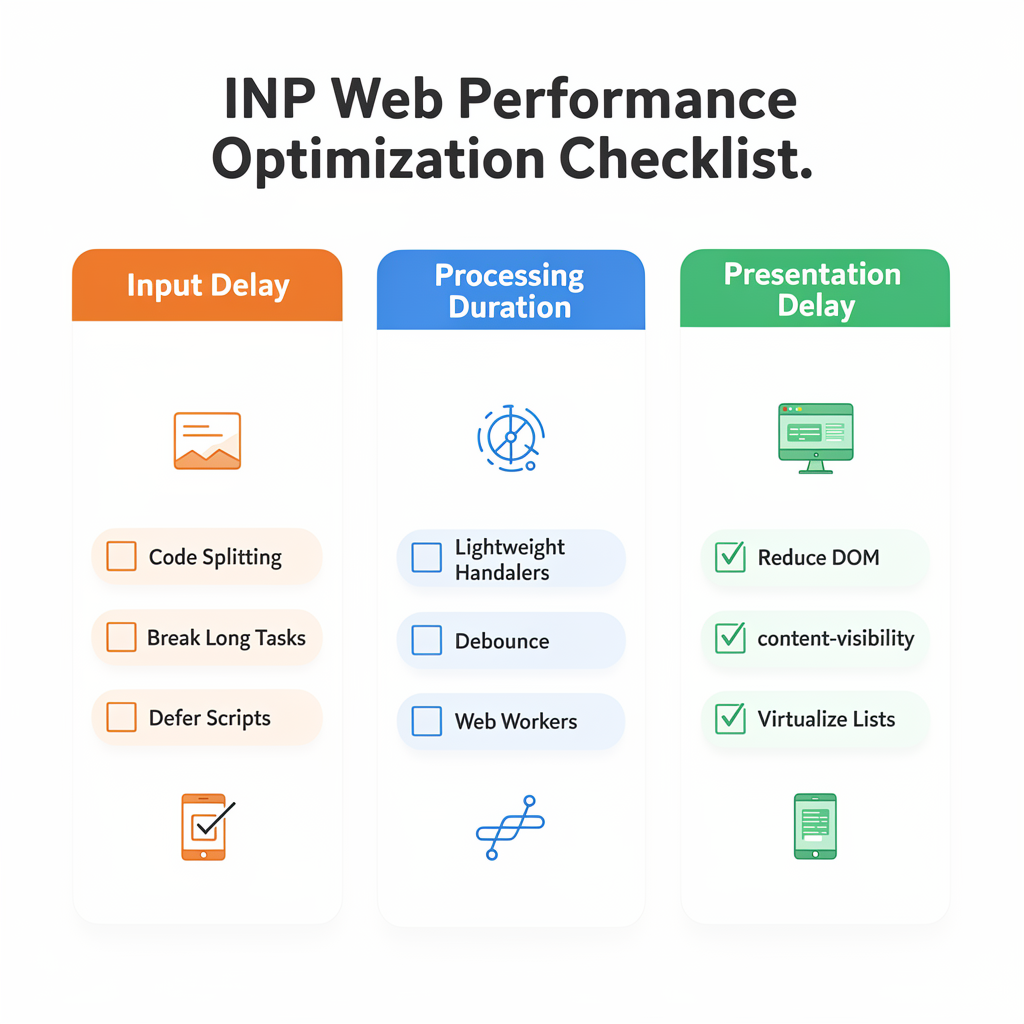
Image Placeholder 5: INP Optimization Checklist Visual
Placement:After Section 12 (INP Optimization Checklist)
Description:A visual checklist organized by the three INP phases, with icons and brief descriptions for each optimization technique.
Alt Text:Visual checklist of INP optimization techniques organized by input delay, processing duration, and presentation delay
Dimensions:1400 × 900px
AI Prompt:“Create an infographic-style checklist with three columns. Column 1: ‘Input Delay’ (orange header) with icons and checkboxes for: Code Splitting, Break Long Tasks, Defer Scripts, Audit Third-Party. Column 2: ‘Processing Duration’ (blue header) with: Lightweight Handlers, Debounce Inputs, Web Workers, Avoid Layout Thrashing. Column 3: ‘Presentation Delay’ (green header) with: Reduce DOM Size, content-visibility, Virtualize Lists, CSS Containment. Use modern icons, checkboxes, and a clean grid layout.”
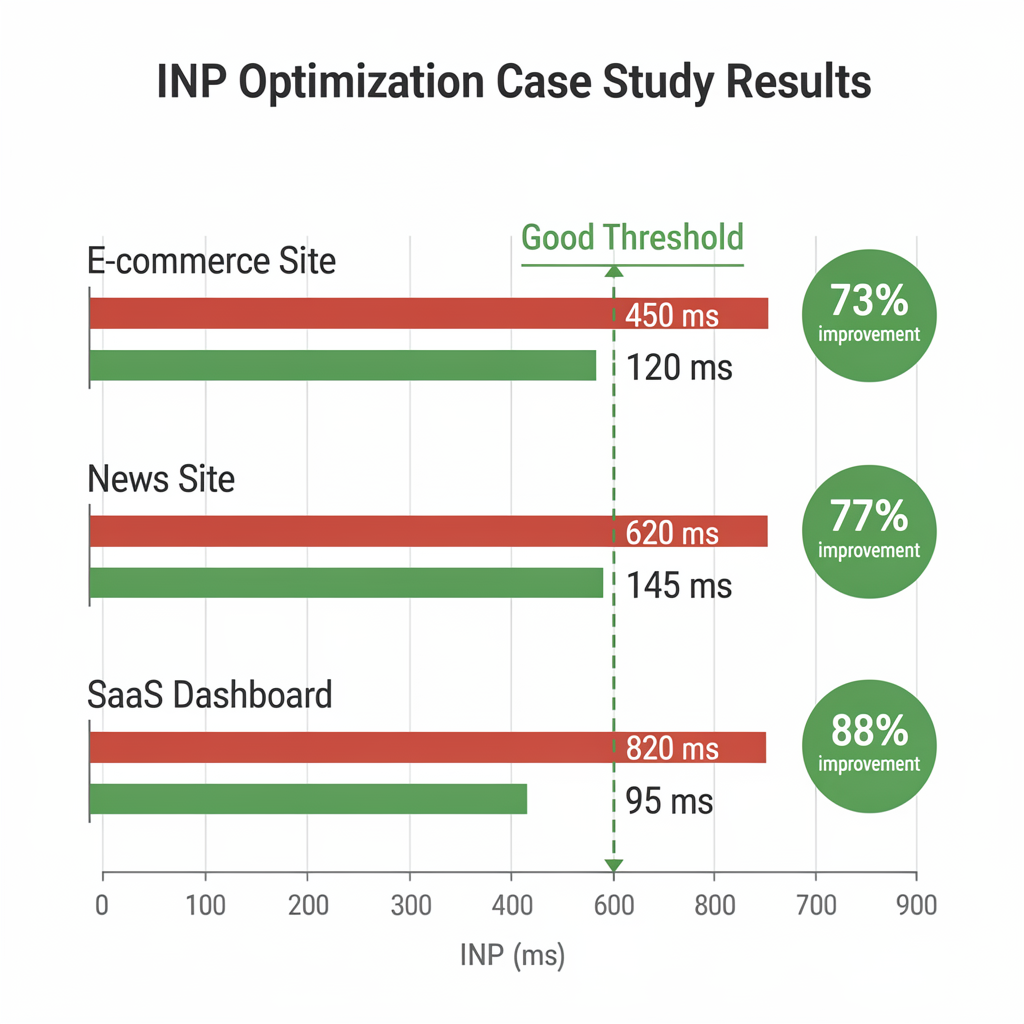
Image Placeholder 6: Case Study Results Bar Chart
Placement:After Section 11 (Real-World Case Studies)
Description:A bar chart showing INP improvements across the three case studies, with before/after comparisons.
Alt Text:Bar chart showing INP improvements from three case studies: e-commerce 73%, news 77%, dashboard 88%
Dimensions:1100 × 600px
AI Prompt:“Create a horizontal bar chart showing ‘INP Optimization Results’. Three groups for ‘E-commerce Product Page’, ‘News Article Page’, ‘Dashboard Application’. Each group has two bars: ‘Before’ (red, showing 450ms, 620ms, 820ms) and ‘After’ (green, showing 120ms, 145ms, 95ms). Add improvement percentage labels (73%, 77%, 88%). Include the 200ms ‘Good’ threshold as a vertical dashed green line. Clean, professional chart style.”
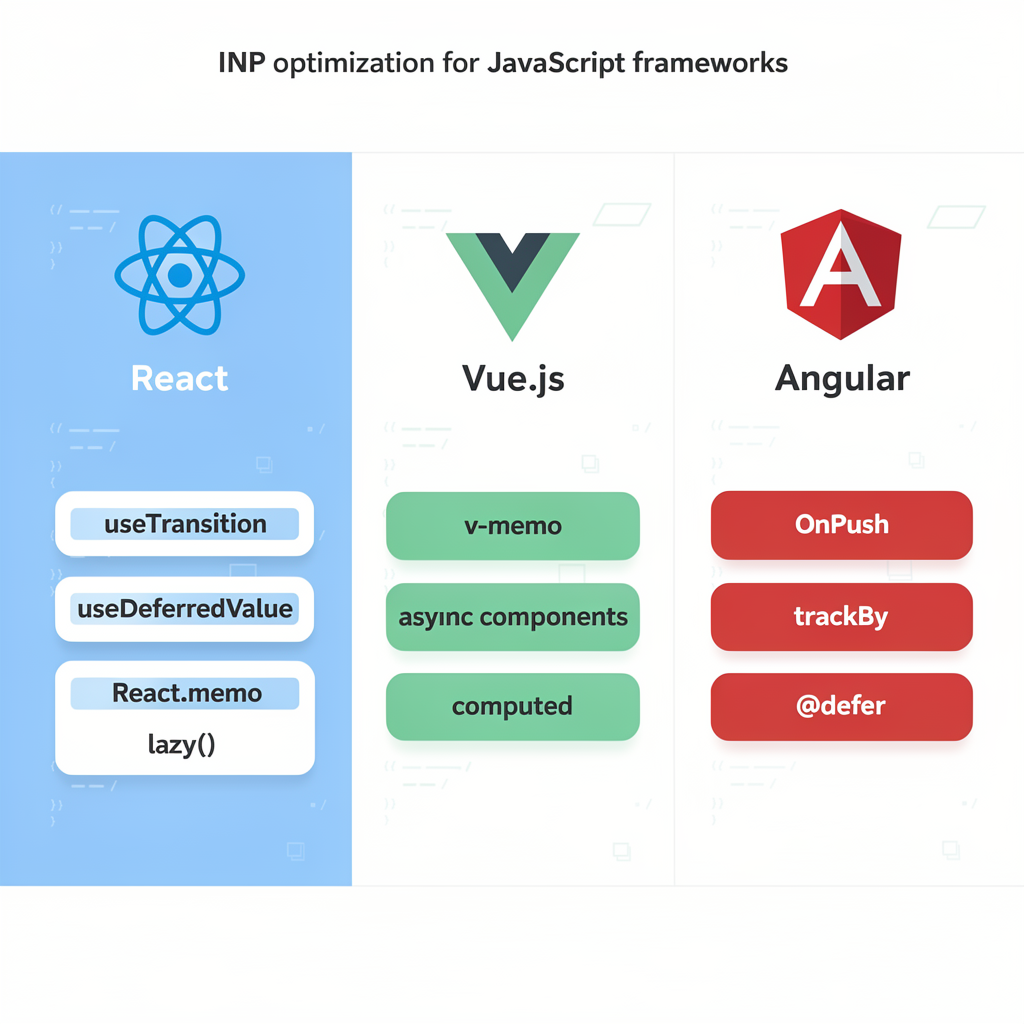
Image Placeholder 7: Framework Optimization Icons
Placement:After Section 10 (Framework-Specific INP Optimization)
Description:Icons representing React, Vue, and Angular with their key INP optimization techniques listed below each.
Alt Text:Framework icons showing key INP optimization techniques for React, Vue, and Angular
Dimensions:1200 × 400px
AI Prompt:“Create a horizontal infographic with three sections for React, Vue, and Angular logos. Under React: ‘useDeferredValue, useTransition, React.memo’. Under Vue: ‘v-memo, async components, computed’. Under Angular: ‘OnPush, trackBy, @defer’. Use official framework colors and logos as icons. Add small code snippet previews under each. Clean, developer-focused design.”
Related LinkGraph Resources
Core Web Vitals & Performance
- What Are Core Web Vitals? (+4 Tips for Improvement)— Complete guide to LCP, CLS, and the evolution from FID to INP
- Google Page Experience Update Guide — How page experience signals affect SEO rankings
- Common JavaScript SEO Issues and How to Fix Them — Solve JS rendering and performance problems
Technical SEO Services
- Technical SEO Services— Beyond audits: fix what’s broken, optimize what’s slow, and unlock higher rankings with Core Web Vitals–ready sites
- Free SEO Audit— Get a comprehensive analysis of your site’s performance
- Enterprise SEO Agency— Scalable technical SEO for large websites
E-Commerce & Industry SEO
- E-Commerce SEO Agency— Product page performance optimization
- E-Commerce SEO Playbook— Boost product visibility in search results
- Local SEO Services— Optimize local business pages for speed
AI & Advanced SEO
- AEO Agency (Answer Engine Optimization)— Optimize for AI-powered search results
- GEO Agency (Generative Engine Optimization)— Position your content for LLM-based search
- Search Atlas Review (2025)— AI-powered SEO platform with Core Web Vitals tracking
Learning Resources
- Local SEO Playbook— Get your business to the top of Local Map Pack
- Link Building SEO Guide for Beginners— Increase site authority and performance signals
- Digital Marketing & SEO Webinars — Expert training on technical SEO
Pages That Should Link TO This Article
The following existing LinkGraph pages should add contextual links to this INP optimization guide:
| Source Page | Suggested Anchor Text | Context |
| Core Web Vitals Guide | “INP optimization guide” | In FID/INP section, link to detailed INP strategies |
| JavaScript SEO | “Interaction to Next Paint” | When discussing JS performance impact |
| Technical SEO Services | “Core Web Vitals optimization” | In speed/performance section |
| Page Experience Update | “optimize Interaction to Next Paint” | When covering responsiveness metrics |
| E-Commerce SEO | “product page responsiveness” | For e-commerce performance |
Contextual Internal Links Within Article
This article already contains strategic links to LinkGraph resources in these sections:
- Introduction: Links to Core Web Vitals guide
- WordPress section: Links to technical SEO services
- Case studies: Links to e-commerce optimization
- Conclusion CTA: Links to consultation booking
Last updated: January 2026
© 2026 LinkGraph. All rights reserved.
