Data Visualizations in SEO Reporting: Beyond Numbers
Enhancing SEO Reporting: The Art of Data Visualization Beyond Mere Numbers In the realm of search engine optimization, raw data sets can seem daunting, yet they hide […]
Enhancing SEO Reporting: The Art of Data Visualization Beyond Mere Numbers
In the realm of search engine optimization, raw data sets can seem daunting, yet they hide a narrative that, when uncovered, can catapult a brand’s online presence to new heights.
LinkGraph takes the lead in transforming these numbers into actionable insights through expert data visualization, which gives life to SEO metrics and guides strategic decisions.
Their suite of tools, including the innovative Search Atlas SEO tool, allows businesses to not only visualize data but also to comprehend the subtleties of their website’s performance.
With an emphasis on crafting SEO reports that resonate with executives and clients alike, the art of data visualization presents a compelling story behind every pie chart, geo chart, and line graph.
Keep reading to explore how these visual reports can become the cornerstone of an effective SEO strategy.
Key Takeaways
- Data Visualization in SEO Provides Clarity and Actionable Insights, Enabling Data-Driven Decision-Making
- LinkGraph’s Search Atlas SEO Tool Enhances Report Interactivity and Narrative Storytelling for Effective Strategy Communication
- Tailored Data Visualization Tools and SEO Reporting Can Reveal Opportunities for Strategic Growth and Competitive Advantage
- Automation and Regular Reporting Rhythms Are Crucial for Maintaining Accurate and Up-to-Date SEO Visual Reports
- Rigorous Data Verification Is Necessary to Ensure the Reliability and Integrity of SEO Visualizations and Insights
Understanding the Basics of Data Visualization

The landscape of SEO reporting has undergone a transformation, with data visualization taking center stage as a pivotal facet of strategic analysis.
As specialists strive to distill vast data sets into actionable intelligence, visualization emerges as an indispensable tool, transcending the clutter of raw figures to deliver insights with clarity and impact.
This introduction to data visualization in the context of search engine optimization sets the stage for an exploration that delves into the evolution of reporting visuals, guiding readers through an enlightened approach to SEO data.
It will illuminate the key benefits such visual tools confer upon marketing professionals and executives alike, enabling a more nuanced understanding of user engagement and website performance.
Defining Data Visualization in the SEO Context
In the realm of search engine optimization, data visualization is conceptualized as the art of converting SEO metrics into graphical representations that unveil patterns, trends, and correlations otherwise obfuscated by spreadsheets and raw data. This transformation enables stakeholders, irrespective of technical expertise, to glean insights and make data-driven decisions with alacrity.
At its core, data visualization in SEO serves to narrate a visual story, weaving disparate data sources into a coherent storyboard that illustrates the dynamics of organic search, visitor behaviors, and campaign outcomes. The graphical delineation of data elevates the comprehension of SEO insights, empowering professionals to optimize strategies with precision.
The Evolution of SEO Reporting Visuals
The dynamic landscape of SEO has seen reporting visuals progress from static tables and text-heavy documents to sophisticated, interactive dashboards. Today’s advanced tools, like LinkGraph’s Search Atlas SEO tool, integrate user interactivity, enabling marketers to drill down into specifics with simple clicks, facilitating more dynamic decision-making processes.
As the demand for more comprehensive interpretations of marketing data has risen, so too has the complexity of visualization types utilized in SEO reports. Modern SEO professionals rely on a cornucopia of charts, from geo charts to intricate bubble charts, allowing for a multifaceted view of performance indicators and the relationships between different data points.
Key Benefits of SEO Data Visualization
A compelling advantage of SEO data visualization is the expedited identification of trends and outlier data that might otherwise remain hidden. Through tools like LinkGraph’s Search Atlas, executives can instantly recognize shifts in SEO performance, capitalizing on opportunities or quickly mitigating challenges, in an environment where time is of the essence.
Data visualization equips professionals with a platform for discussing SEO strategies and outcomes with clients or team members in clear, visually engaging ways. By translating technical SEO metrics into intuitive charts and graphs, LinkGraph’s SEO services ensure that both experts and clients maintain an aligned vision for success, effectively bridging the gap between data analysis and strategic application.
Crafting a Narrative With SEO Data

In the nuanced theater of SEO, data no longer serves as a mere prop; it assumes the leading role, narrating the unique story of a brand’s online journey.
Aptly termed ‘data storytelling,’ this craft marries the analytical rigor of SEO with the artful finesse of narrative, transforming the complex tableau of SEO metrics into a digestible and persuasive narrative.
Through the lens of LinkGraph’s SEO services, industry professionals wield storytelling techniques to distill intricate data into engaging reports, ensuring SEO strategies are not only understood but also championed by clients and stakeholders.
With a focus on showcasing real-world applications, case studies exemplify the potent effectiveness of narrative-driven SEO reports in conveying strategy, progress, and success.
Storytelling Techniques for Effective Reporting
Effective reporting in SEO transcends the mere presentation of numbers; it involves the skilful application of storytelling techniques to craft a narrative that resonates with the audience. To truly captivate and inform stakeholders, SEO experts at LinkGraph adopt a strategic approach, wherein each visualization is carefully selected to illuminate the undercurrents of campaign performance and align the data’s story with the brand’s overarching objectives.
Within this narrative framework, emphasis is placed on the flow and progression of data points, leading audiences through a journey from initial strategy to realized outcomes. LinkGraph’s Search Atlas SEO tool helps bring this journey to life, with intuitive dashboard templates and charts that emphasize growth, highlight achievements, and pinpoint areas for optimization, thus allowing professionals to communicate complex SEO insights in a compelling and approachable manner.
Translating Complex Data Into Compelling Stories
The intricacies of SEO data unfold into compelling narratives when professionals like those at LinkGraph harness the power of data visualization tools. By presenting SEO metrics through well-constructed visual stories, they enable clients to see beyond the numbers and grasp the tangible impacts of their SEO strategies on business outcomes.
Visual narratives foster a deeper appreciation of the ebbs and flows in campaign performance, illustrating how user behaviors and market shifts influence a website’s digital footprint. LinkGraph’s adept use of data visualization charts transforms complex SEO data into relatable insights, thereby turning abstract metrics into meaningful strategies for growth:
- Identification of key performance indicators through visualization tools, spotlighting progress and areas for enhancement.
- Usage of geo charts to showcase the geographical distribution of website visitors and their behaviors, offering a clear view of audience engagement across different regions.
- Integration of line and bar charts to track trends over time, revealing the impacts of SEO efforts on organic search rankings and website traffic.
- Utilization of interactive dashboards for real-time SEO data analysis, empowering stakeholders to make informed decisions swiftly.
Case Studies: Narrative-Driven SEO Reports
Catering to the appetite for empirical evidence, LinkGraph’s SEO services anchor their value proposition in the substantiation provided by case studies. These reports crystallize the efficacy of data-driven narratives, detailing how visualization tools have steered client campaigns toward measurable triumph, from significant surges in search result rankings to notable growth in targeted traffic.
Through these curated reports, LinkGraph transforms abstract figures into illustrative success stories, displaying the direct correlation between a well-orchestrated SEO strategy and improved business metrics. Clients gain not just visibility into the return on their SEO investments, but also a strategic roadmap informed by LinkGraph’s insightful case-specific analyses and bespoke data visualizations.
Advanced Visualization Tools and Their Impact on SEO

In the quest to elevate search engine optimization, professionals have embraced advanced visualization tools, recognizing their potency in transforming SEO data into compelling, actionable insights.
These technologies not only clarify the narrative behind the numbers but also enhance the decision-making process for SEO professionals and stakeholders.
Examining popular SEO visualization tools unveils a landscape rich with options, tailored to meet diverse reporting requirements.
Matching the right tool to specific reporting needs optimizes data analysis, while seamless integration into existing SEO workflows streamlines processes, solidifying data visualization as a cornerstone of modern SEO practice.
Overview of Popular SEO Visualization Tools
Exploring the arsenal of SEO visualization tools reveals a bevy of software engineered to enhance the interpretability of intricate SEO data. Among them, LinkGraph’s Search Atlas SEO tool distinguishes itself by facilitating the creation of SEO reports rich with interactive data visualization capabilities that cater to the diverse needs of digital marketers and business intelligence analysts.
LinkGraph’s services, including the Search Atlas tool, are particularly adept at merging multiple data sources and presenting them through a variety of visualization types: from bar charts that measure progress over time to geo charts that capture audience distribution. These tools ensure that insights are not only accessible but also actionable:
- Bar charts simplify the comparison of key metrics, thereby illuminating shifts in performance.
- Geo charts enable a visual understanding of global traffic patterns, enhancing targeting strategies for different regions.
- Line charts trace the trajectory of SEO efforts, reflecting their influence on organic search visibility.
Matching Tools With Specific Reporting Needs
The selection of the most suitable SEO reporting tool is contingent upon the distinctive needs of the campaign and the nuances of the targeted metrics: Certain campaigns require precise geographic tracking, others demand the tracking of visitor engagement over time with a specific focus on bounce rate and session duration. LinkGraph’s Search Atlas SEO tool exemplifies a solution oriented towards such bespoke demand, offering a wide array of charts and widgets that are customizable to the granular needs of a nuanced campaign.
| Campaign Aspect | SEO Reporting Need | Visualization Tool |
|---|---|---|
| Geographic Performance | Detailed Regional Analysis | Geo Charts |
| User Engagement | Session Duration and Bounce Rate | Line Charts |
| SEO Strategy Outcome | Long-term Performance Indicators | Area Charts |
Ensuring that a chosen visualization tool integrates seamlessly with current data sources and existing marketing dashboards is fundamental to its efficacy: The tool should not only visualize but also synthesize data from various streams such as PPC, SEO, and even offline marketing efforts. LinkGraph’s suite, with its comprehensive data studio dashboards and APIs, assists marketers in creating a cohesive narrative that reflects the holistic impact of a brand’s marketing efforts across multiple platforms.
Integrating Tools Into Your SEO Workflow
Integration of sophisticated tools into an SEO professional’s workflow is paramount for translating intricate datasets into a clear strategic direction. LinkGraph’s Search Atlas SEO tool exemplifies precision in catered solutions, allowing seamless inclusion into existing practices with robust customization options for precise SEO analysis and reporting.
Effective workflow integration is not simply about the accumulation of data; it demands meticulous synchronization to ensure every piece of marketing data propels the SEO journey forward. Innovations like LinkGraph’s platform transform the user experience, harmonizing data across touchpoints to forge a unified, insightful narrative that underpins SEO campaigns:
- Tracking real-time data to quickly adapt SEO strategies as market dynamics shift.
- Automating data collection and report generation to focus resources on strategic analysis.
- Simplifying collaboration through shared dashboards that foster cohesive team action.
Incorporating Visualization Into SEO Metric Reporting
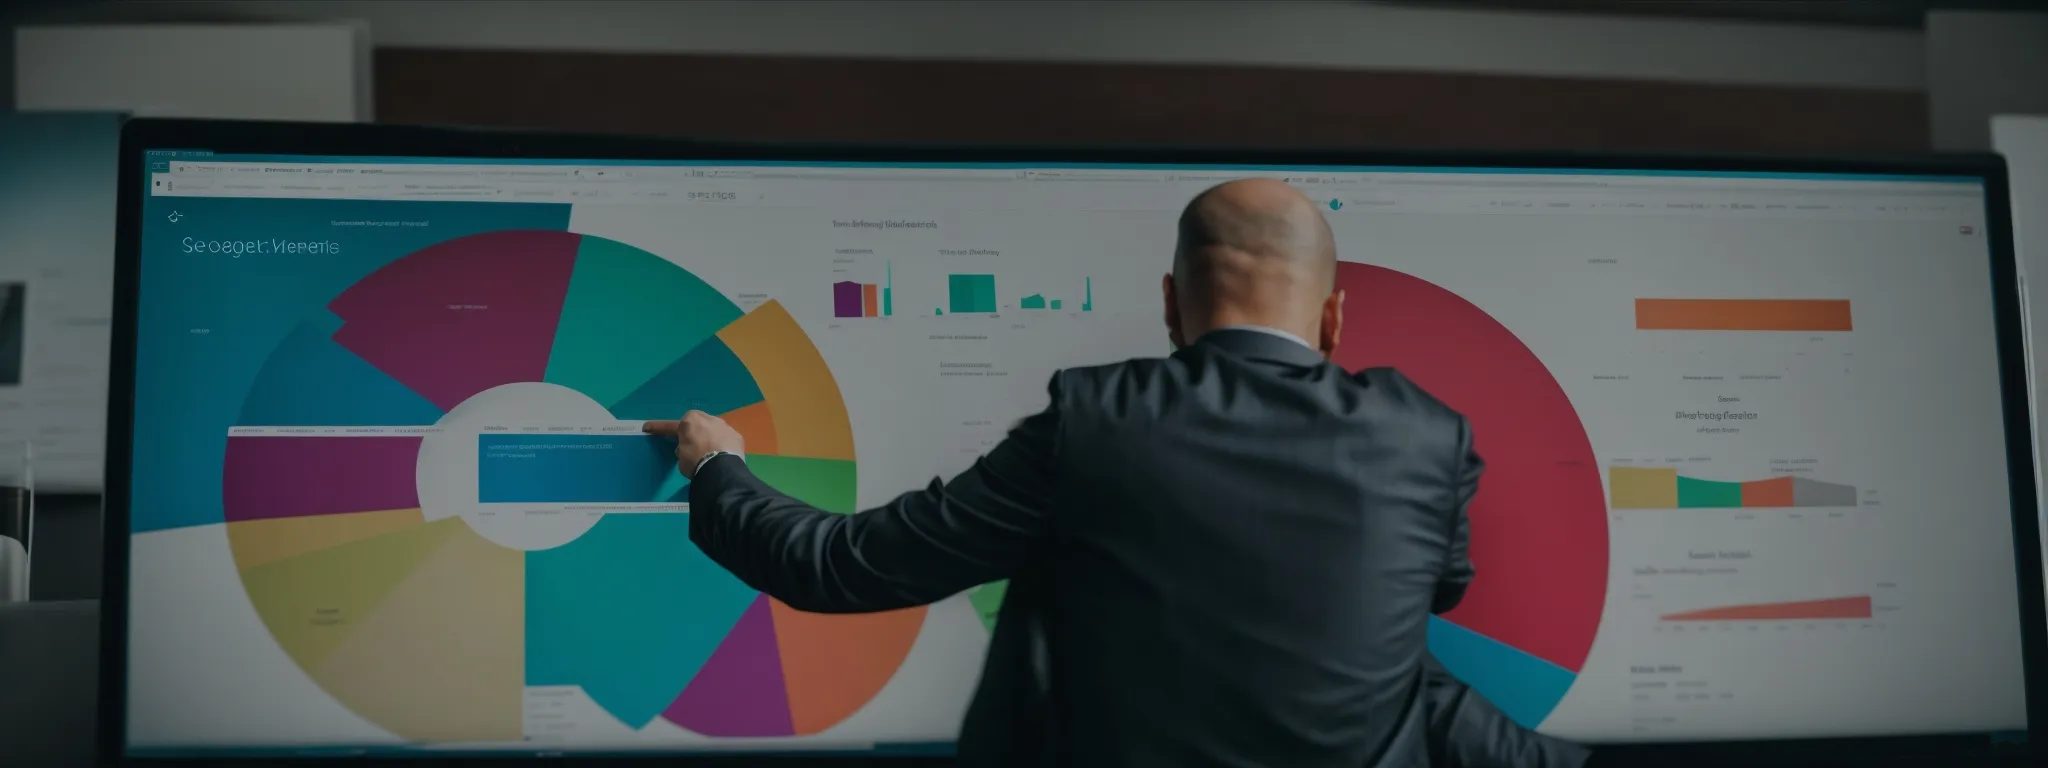
As the digital age burgeons, the role of data in shaping search engine optimization strategies has become indisputable.
In an environment where every interaction counts, providing an unambiguous interpretation of performance indicators underscore a marketer’s ability to convey value to stakeholders.
The adoption of data visualization tools in SEO metric reporting is not merely a trend; it is a strategic imperative.
This integration seeks to enhance the presentation of complex SEO analytics, ensuring reporting transcends raw numbers to embody the intricacies of campaign dynamics.
Selecting the correct visual aids, deploying informative infographics, and marshalling dynamic charts to chart progress are vital steps toward optimizing the communication of SEO endeavors over time.
Selecting the Right Visuals for Key SEO Metrics
Selecting appropriate visuals for key SEO metrics is an exercise in precision, one that LinkGraph’s SEO services approach with strategic acumen. The choice of a bar chart, line chart, or pie chart, for instance, hinges on the specific metric being portrayed, like bounce rate, click-through rates (CTR), or backlink profiles, ensuring the visualization communicates the data’s essence with utmost clarity.
How these visuals integrate into the overall SEO report template matters greatly: they must enhance comprehension and facilitate the detection of patterns critical for data-driven decisions. LinkGraph’s professionals match visual types with the nuances of specific metrics:
| Metric | Visual Type | Importance |
|---|---|---|
| Bounce Rate | Area Chart | Highlighting visitor engagement over time |
| CTR | Column Chart | Comparing performance across campaigns |
| Backlinks | Bubble Chart | Visualizing link diversity and quality |
Ultimately, the efficacy of an SEO campaign’s visualization lies in its ability to succinctly convey complex information and foster informed business decisions, a benchmark consistently met by LinkGraph’s suite of SEO reporting tools.
Making Data More Accessible With Infographics
Infographics serve as a bridge, translating data-laden SEO reports into accessible insights for a broad audience. LinkGraph harnesses this visual mechanism to distill SEO analytics into vivid, digestible content, magnifying the reach and understanding of complex data across disciplines.
The power of infographics lies in their ability to meld educational content with aesthetic appeal, ensuring that pivotal SEO metrics resonate with clients and stakeholders. By leveraging these compelling visuals, LinkGraph’s professionals illuminate data narratives, fostering an environment where strategic decisions are informed by a clear and engaging representation of SEO insights.
Tracking Progress Over Time With Dynamic Charts
Dynamic charts are the backbone of monitoring SEO trends over extended periods, providing a temporal dimension to data analysis. They offer intuitive visualization that captures the trajectory of SEO campaigns, reflecting how incremental changes accumulate to impact overall performance.
The utility of dynamic charts is evident when delineating the progression of website traffic, keyword rankings, and various other SEO metrics: Line charts and area charts emerge as potent storytellers, marking the peaks and troughs of a campaign’s journey. They invite users to peer into historical data, discern patterns, and forecast future trends with greater confidence:
| Time Frame | SEO Metric | Dynamic Chart Type | Trends Observed |
|---|---|---|---|
| Quarterly | Organic Traffic | Line Chart | Seasonal peaks and contractions |
| Monthly | Keyword Rankings | Area Chart | Impact of content updates and SEO optimizations |
Adept handling of these dynamic tools facilitates not just passive observation but proactive strategy adjustments: Marketers are poised to pivot as they identify growth opportunities or mitigate dips in expected performance results. The illustrations these charts provide become more than mere reflections of data; they narrate the ongoing story of an SEO effort’s evolution and resilience.
Using Data Visualizations to Highlight SEO Opportunities

The meticulous art of rendering search engine optimization (SEO) data into intuitive visual formats stands as a transformative process for reporting, ushering in enhanced recognition of buried opportunities.
Data visualization transcends conventional analysis, imbuing professionals with the capacity to identify trends, assess competitor metrics, and leverage emerging SEO patterns for strategic advantage.
LinkGraph’s refined approach couples sophisticated tools with analytical prowess, ensuring that these opportunities are not only illuminated but also strategically pursued to invigorate and propel SEO campaigns.
Identifying Trends Through Visual Analysis
In the intricate landscape of SEO, visual analysis serves as a beacon, guiding professionals through the dense fog of raw data toward clear, actionable trends. LinkGraph harnesses this analytical method within its SEO services, allowing stakeholders to visually track and decipher patterns that signal both opportunities and areas requiring attention.
- Analyzing visualization data elucidates seasonal spikes in user interest, enabling timely content creation and targeted marketing campaigns.
- Examining geo chart distributions reveals untapped markets, presenting the possibility for geographic expansion or localized SEO efforts.
- Interpreting line and bar chart trends informs adjustments in keyword strategy, aligning with user search behaviors and improving the relevance of web content.
By converting SEO metrics into comprehensive visual formats, LinkGraph crystallizes disparate data points into a coherent narrative of growth potential. This transformative capability within their visualization tools empowers users to not only recognize patterns but also to make predictive decisions that drive SEO success.
Visualizing Competitor Metrics for Strategic Insights
In the ever-competitive domain of digital marketing, identifying gaps in a competitor’s SEO strategy can provide a significant edge. LinkGraph’s SEO services leverage data visualization to grant a clear vantage point over competitor metrics, transforming this insight into actionable intelligence that sharpens the competitive positioning of a brand’s online presence.
The strategic juxtaposition of visual competitor analytics allows stakeholders to pinpoint areas where their SEO efforts can be amplified to outperform rivals. By employing visual comparison through LinkGraph’s meticulous SEO reporting, companies discern trends and strategies within their market space, paving the way for informed adjustments to their own SEO tactics.
Spotting and Capitalizing on Emerging SEO Patterns
Emerging SEO patterns often signal the advent of new user behaviors and technological advancements; LinkGraph’s SEO services empower businesses to detect these subtleties by way of advanced data visualization. Utilizing comprehensive seo reporting tools, professionals can swiftly isolate and analyze these nascent trends, positioning clients at the forefront of innovation and ensuring continued digital relevance.
LinkGraph’s sophistication in data visualization allows for the expeditious transformation of emergents into opportunities: identifying a nascent uptick in voice search queries, for instance, might signify the need for an adapted keyword strategy. SEO experts leverage these insights to refine their approach, ensuring content and on-page elements are optimized for the ways in which target audiences are evolving their search practices:
| SEO Pattern | Action Taken | Outcome |
|---|---|---|
| Increased Voice Search Queries | Optimize Long-Tail Keywords | Enhanced Visibility in Voice Search Results |
| Rise in Mobile-First Browsing | Implement Mobile Optimization | Improved User Experience and Engagement |
Visual Reports That Drive Decision-Making

Within the multifaceted realm of SEO, the development of visual reports emerges as a critical practice that holds the power to forge clarity from complexity and inspire prudent decision-making.
By integrating incisive visual elements into SEO reports, LinkGraph’s expertise in data visualization provides a crystalline lens through which decision-makers can evaluate SEO investments, align strategies with business objectives, and satisfy the diverse informational prerequisites of stakeholders.
Engaging visuals not only punctuate the immense data landscape but they shape it into purposeful insights, tailoring a narrative that’s accessible and actionable for various decision-making echelons within an organization.
Creating Clear, Actionable SEO Reports
LinkGraph’s dedication to crafting clear, actionable SEO reports manifests in the methodical curation of data visualization techniques that resonate with the unique demands of each client. Their approach entails leveraging strategic dashboard templates and intuitive visualizations that distill complex datasets into coherent narratives, effectively simplifying the decision-making process for businesses seeking to enhance their online presence.
The employment of sophisticated SEO reporting tools by LinkGraph’s experts results in reports that not only illuminate performance metrics but also exemplify strategic recommendations, enabling stakeholders to grasp the implications of their SEO investments with precision. Emphasizing the actionable over the analytical, these reports serve as guiding documents that propel SEO campaigns towards measurable outcomes through a clear articulation of data-driven strategies.
Using Visuals to Support SEO Investment Decisions
In the pursuit of SEO excellence, leveraging visual aids streamlines the investment decision-making process, offering stakeholders a compelling representation of return on investment (ROI). LinkGraph’s Search Atlas tool facilitates such decision-making by transforming complex SEO data into digestible visual reports that highlight one’s investment’s effectiveness.
By visualizing key performance data, executives can rapidly assess the impact of their SEO strategies, ensuring that financial resources are directed towards efforts that yield tangible results. These insights foster strategic agility, steering investment towards the most promising SEO avenues:
- SEO trends and their correlation with business goals become clear, prompting informed budget allocation.
- The measurable success of various SEO actions is depicted, guiding further investment in high-performance initiatives.
- Visual reports demystify the complexities of SEO analytics, equipping stakeholders with clear benchmarks for future investments.
Tailoring Visuals for Different Stakeholder Needs
In the multifaceted world of SEO, LinkGraph recognizes the imperative of tailoring visualization for distinctive stakeholder perspectives. Customized visual data presentations cater to the diverse information processing preferences of executives, yielding clarity and fostering engagement with nuanced SEO data narratives.
Marketing teams and clients alike benefit from LinkGraph’s precise matching of visual types to stakeholder functions, thus ensuring that each visual report is not just a conglomeration of data but a strategic tool that aligns with the decision-maker’s objectives. LinkGraph’s expertise in data visualization ensures that every stakeholder, from the technically inclined to the strategically focused, receives data in the most comprehensible and actionable format.
Best Practices for Maintaining Accurate Visual SEO Reports

Amid the contemporary surge in the utilization of SEO metrics for strategic enhancement, the relevance of maintaining precise and current visual reports cannot be overstated.
Embedding best practices in the maintenance of visual SEO reports transcends the mere display of data, ensuring that the information conveyed remains an infallible touchstone of business intelligence.
Encompassing the employment of automation techniques to ensure data freshness, the establishment of consistent reporting rhythms, and the rigorous upkeep of data integrity, these practices fortify the trustworthiness of the visuals.
By adhering to these cornerstones, industry professionals can engrave a narrative that is as accurate as it is persuasive, providing an unwavering basis for impactful decision-making.
Keeping Data Up-to-Date With Automation Techniques
The quest for precision in SEO reporting is continually refined through the deployment of automation techniques in data upkeep. Automation serves as the linchpin to the real-time accuracy of visual reports, securing a dynamic symmetry between evolving SEO campaigns and dashboard representations.
LinkGraph’s SEO services apply automated data feeds to fuel visualizations with the latest information, constantly refreshing the SEO dashboard. This ensures that each visual element, from line charts exemplifying keyword rankings to pie charts denoting audience segments, embodies the most up-to-date insights:
| Data Metric | Visualization Type | Automation Benefit |
|---|---|---|
| Keyword Rankings | Line Chart | Immediate reflection of ranking fluctuations |
| Audience Segments | Pie Chart | Instant updates on visitor demographics |
| Backlink Profile | Bubble Chart | Continuous tracking of link quality and quantity |
Establishing a Regular Reporting Schedule
Instilling a sense of regularity in reporting is paramount to the sustained accuracy and relevance of visual SEO reports. LinkGraph champions this discipline by designating routine intervals for the dissemination of insightful visual analyses, ensuring stakeholders are in possession of the latest SEO metrics to inform their decision-making processes.
This commitment to a structured reporting schedule fortifies the strategic continuity of SEO campaigns, providing a reliable foundation upon which executives and marketing teams can assess progress and adjust tactics in alignment with evolving business objectives and market conditions.
Ensuring Data Integrity and Reliability in Visuals
To ensure the integrity and reliability of visual SEO reports, LinkGraph prioritizes meticulous verification of all data sources. By rigorously auditing input data, the potential for erroneous information to misguide SEO strategies and decision-making is significantly curtailed.
LinkGraph’s adherence to stringent data quality checks safeguards visuals from inaccuracies, fostering trust in SEO reporting. Continuous monitoring and validation processes underpin the reliability of each chart and graph, thereby anchoring the strategic insights they impart:
- Data sources are authenticated and cross-referenced to guarantee accuracy.
- Visual representations undergo strict quality control prior to inclusion in reports.
- Anomalies are methodically investigated to ensure data coherence and consistency.
Conclusion
The incorporation of data visualization into SEO reporting is a game-changer, providing clarity and actionable insights from complex data that go far beyond what numbers alone can offer.
By transforming SEO metrics into graphic representations, stakeholders at all levels can quickly identify trends, comprehend campaign dynamics, and make informed decisions.
Advanced visualization tools like LinkGraph’s Search Atlas SEO tool have revolutionized this domain, allowing the blending of technical SEO analysis with narrative storytelling to effectively communicate strategies and outcomes.
Utilizing dynamic charts and infographics, marketers can now showcase real-world impacts of SEO strategies.
Through visual storytelling, SEO data is not just presented but brought to life, empowering businesses to recognize opportunities, track progress, and fine-tune their SEO investments.
In essence, data visualization is a strategic imperative for modern SEO, crafting a visual narrative that drives decision-making and ensures that every SEO action is clearly aligned with business objectives.


